 4
4peptides
spectra
0.557 | 0.604
0.000 | 0.000
0.195 | 0.260
0.023 | 0.103
0.053 | 0.134
0.000 | 0.044
0.000 | 0.004
0.000 | 0.024
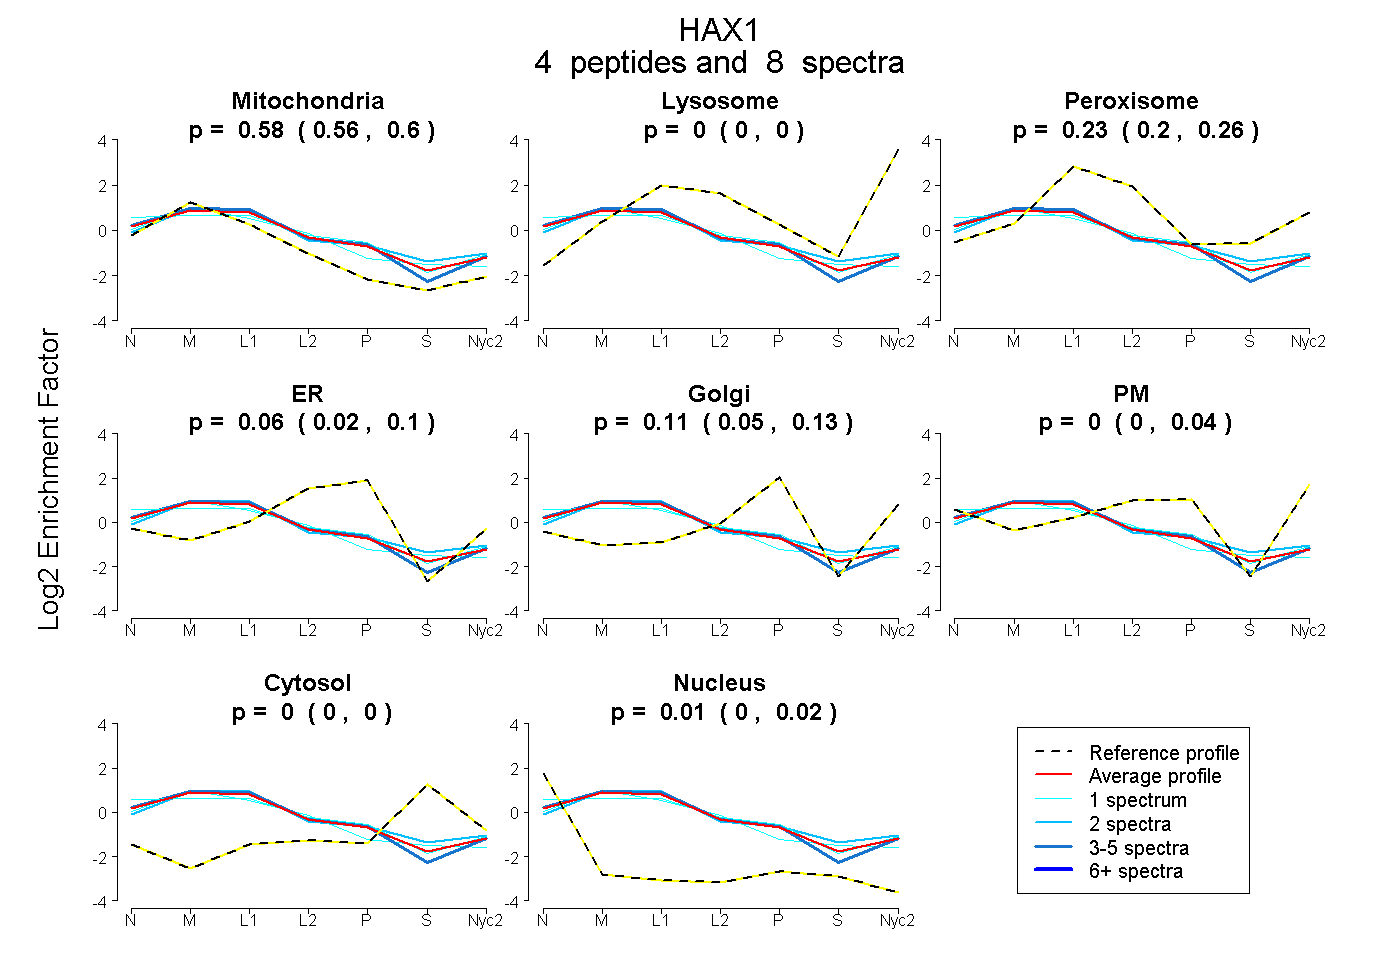
| Plot | Mito | Lyso | Perox | ER | Golgi | PM | Cytosol | Nucleus | |||||
| Expt A |
4 peptides |
8 spectra |
|
0.583 0.557 | 0.604 |
0.000 0.000 | 0.000 |
0.235 0.195 | 0.260 |
0.064 0.023 | 0.103 |
0.108 0.053 | 0.134 |
0.000 0.000 | 0.044 |
0.000 0.000 | 0.004 |
0.010 0.000 | 0.024 |
| 4 spectra, GFFGFPGPR | 0.618 | 0.000 | 0.135 | 0.131 | 0.000 | 0.116 | 0.000 | 0.000 | ||
| 1 spectrum, YPDSHQPR | 0.479 | 0.000 | 0.182 | 0.104 | 0.000 | 0.170 | 0.000 | 0.065 | ||
| 1 spectrum, FHGNFGFDDLVR | 0.656 | 0.000 | 0.201 | 0.076 | 0.000 | 0.000 | 0.067 | 0.000 | ||
| 2 spectra, DPFFGGMTR | 0.545 | 0.000 | 0.289 | 0.000 | 0.126 | 0.000 | 0.040 | 0.000 |
| Plot | Mito | Lyso or Perox | ER | Golgi | PM | Cytosol | Nucleus | ||||||
| Expt B |
2 peptides |
2 spectra |
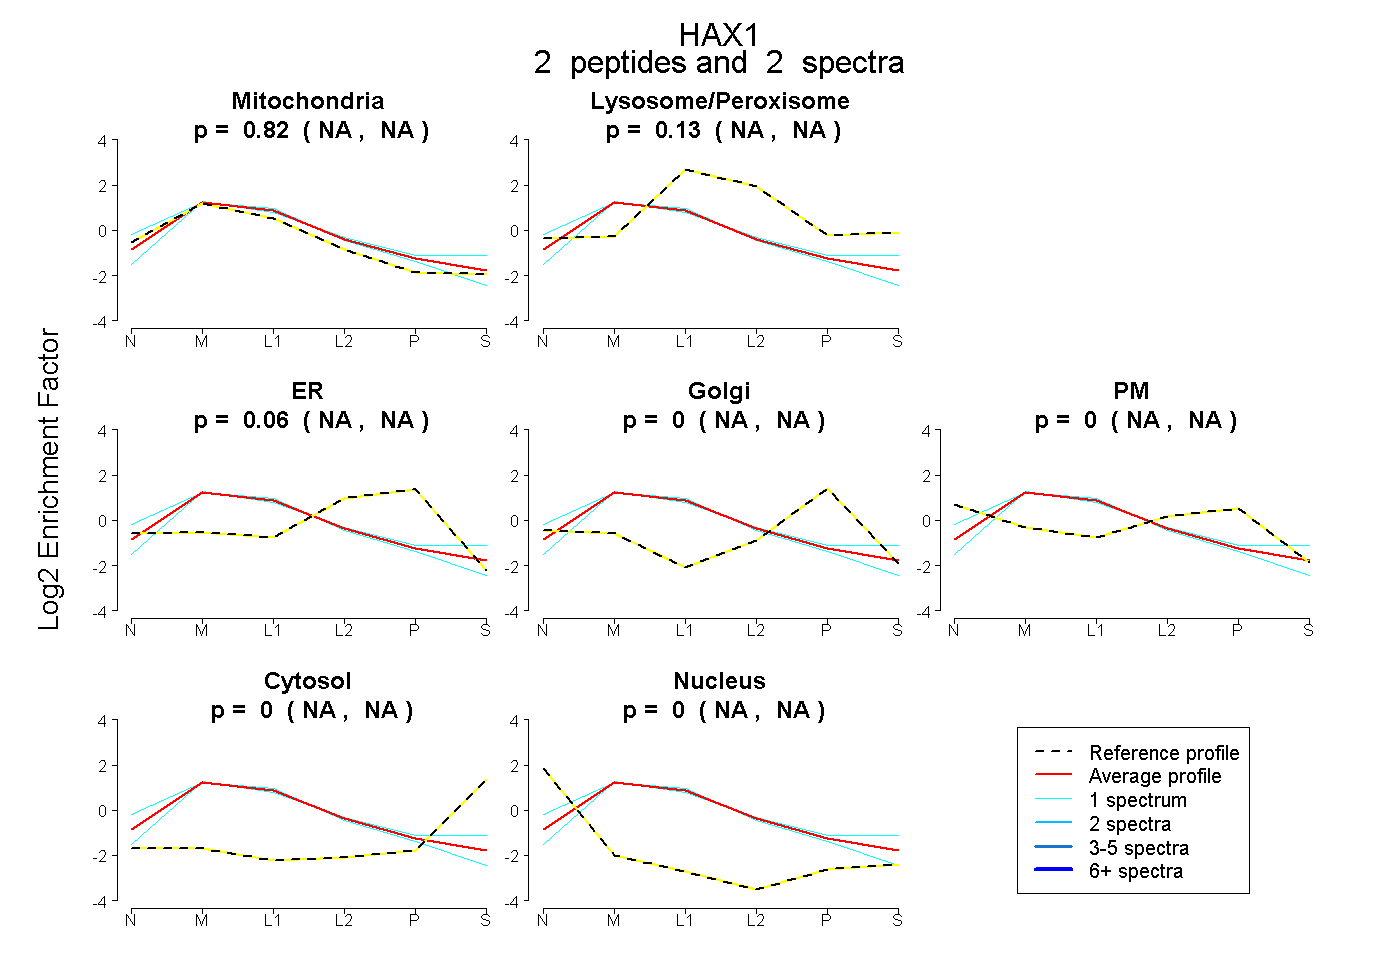 |
0.818 NA | NA |
0.126 NA | NA |
0.056 NA | NA |
0.000 NA | NA |
0.000 NA | NA |
0.000 NA | NA |
0.000 NA | NA |
|||
| Plot | Lyso | Other | |||||||||||
| Expt C |
4 peptides |
27 spectra |
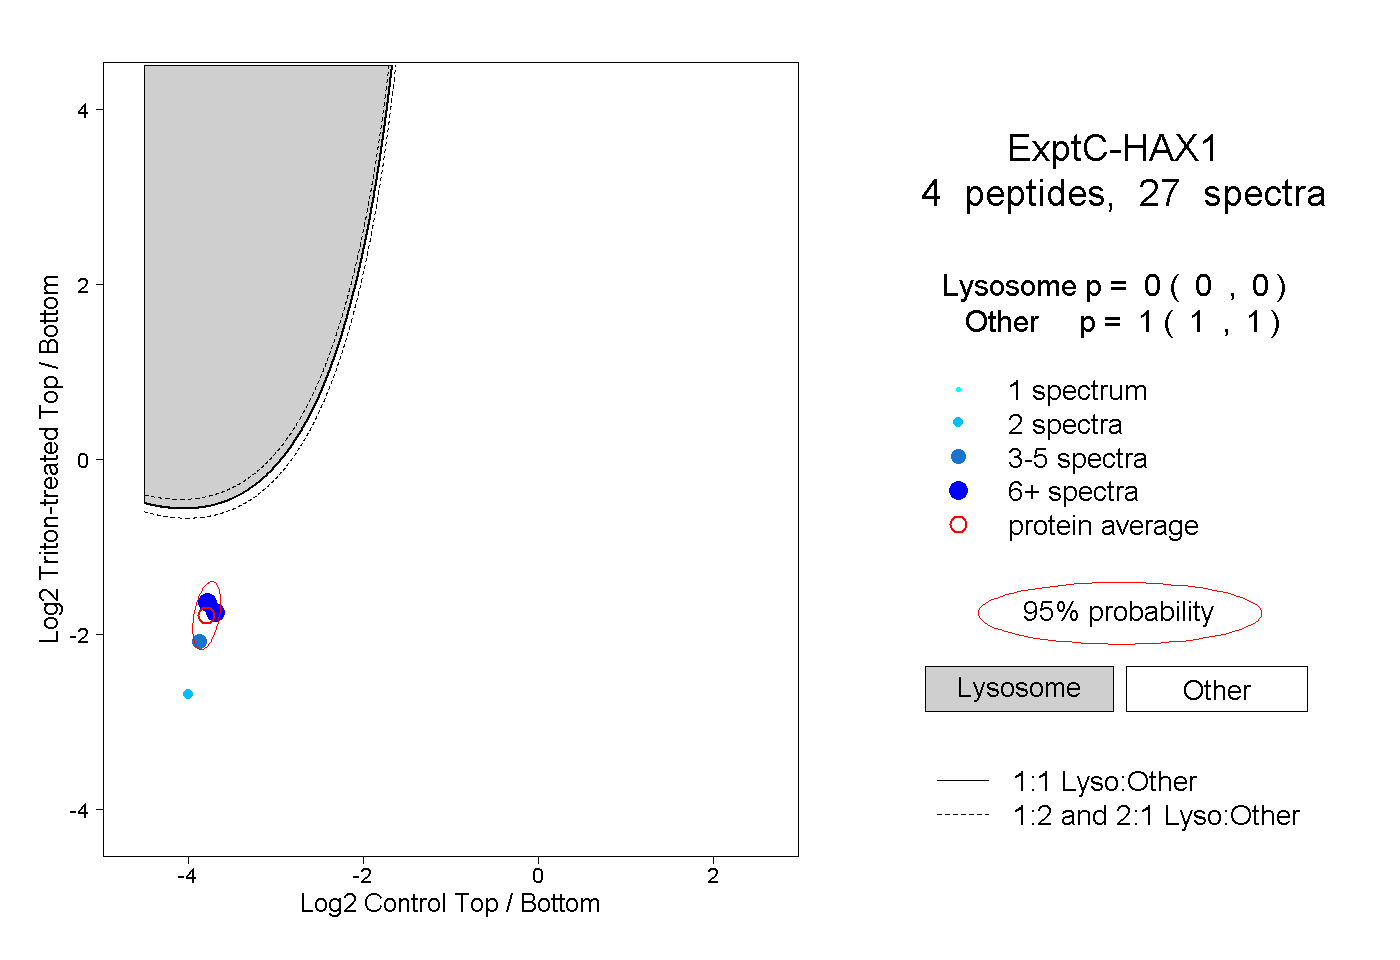 |
0.000 0.000 | 0.000 |
1.000 1.000 | 1.000 |
||||||||
| Plot | Lyso | Other | |||||||||||
| Expt D |
2 peptides |
3 spectra |
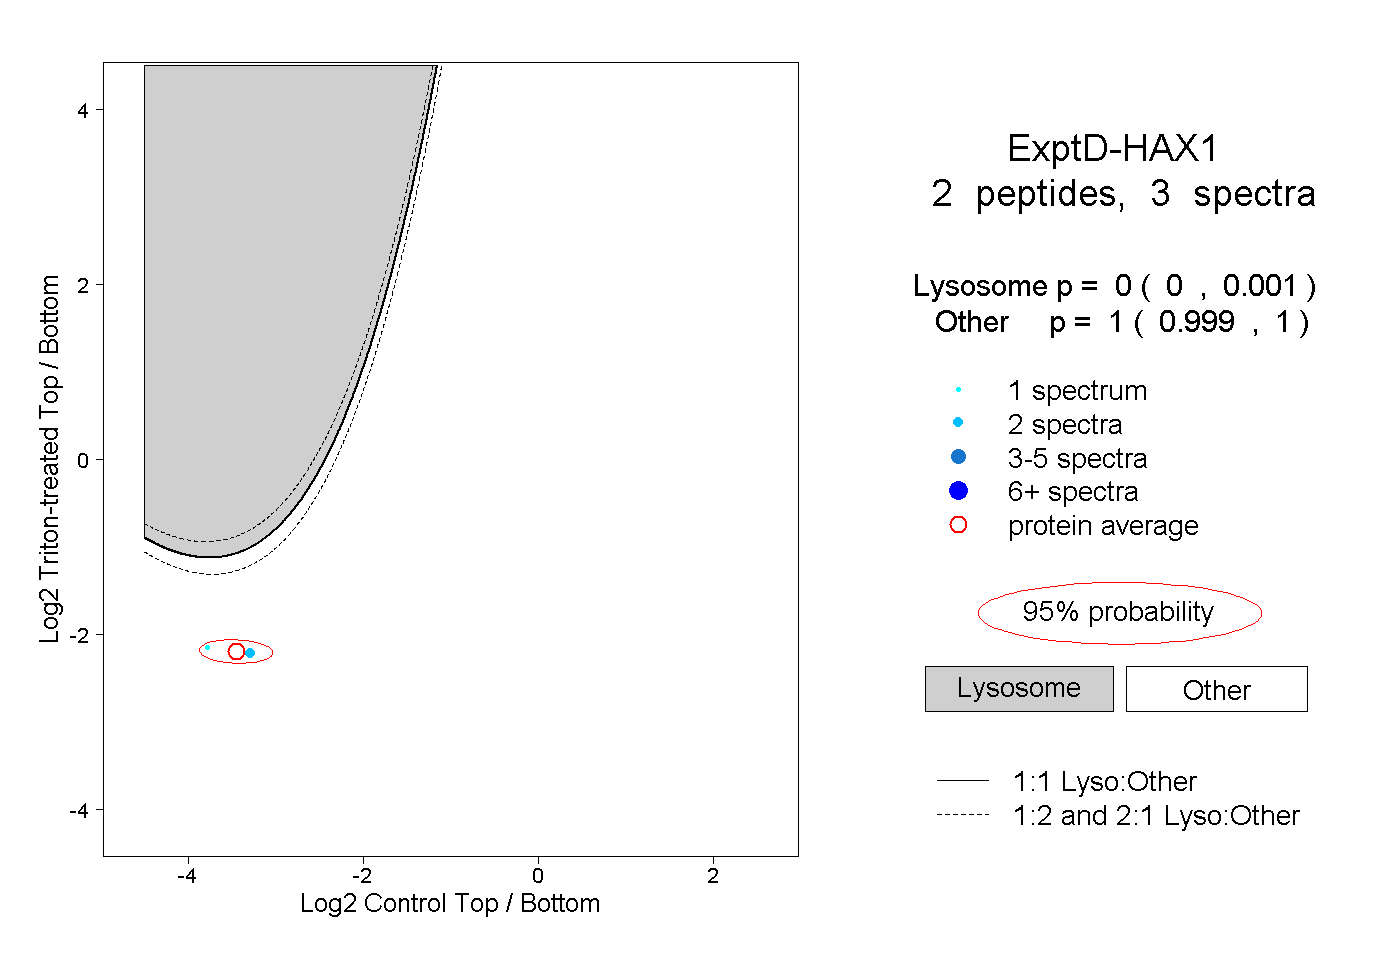 |
0.000 0.000 | 0.001 |
1.000 0.999 | 1.000 |