 15
15peptides
spectra
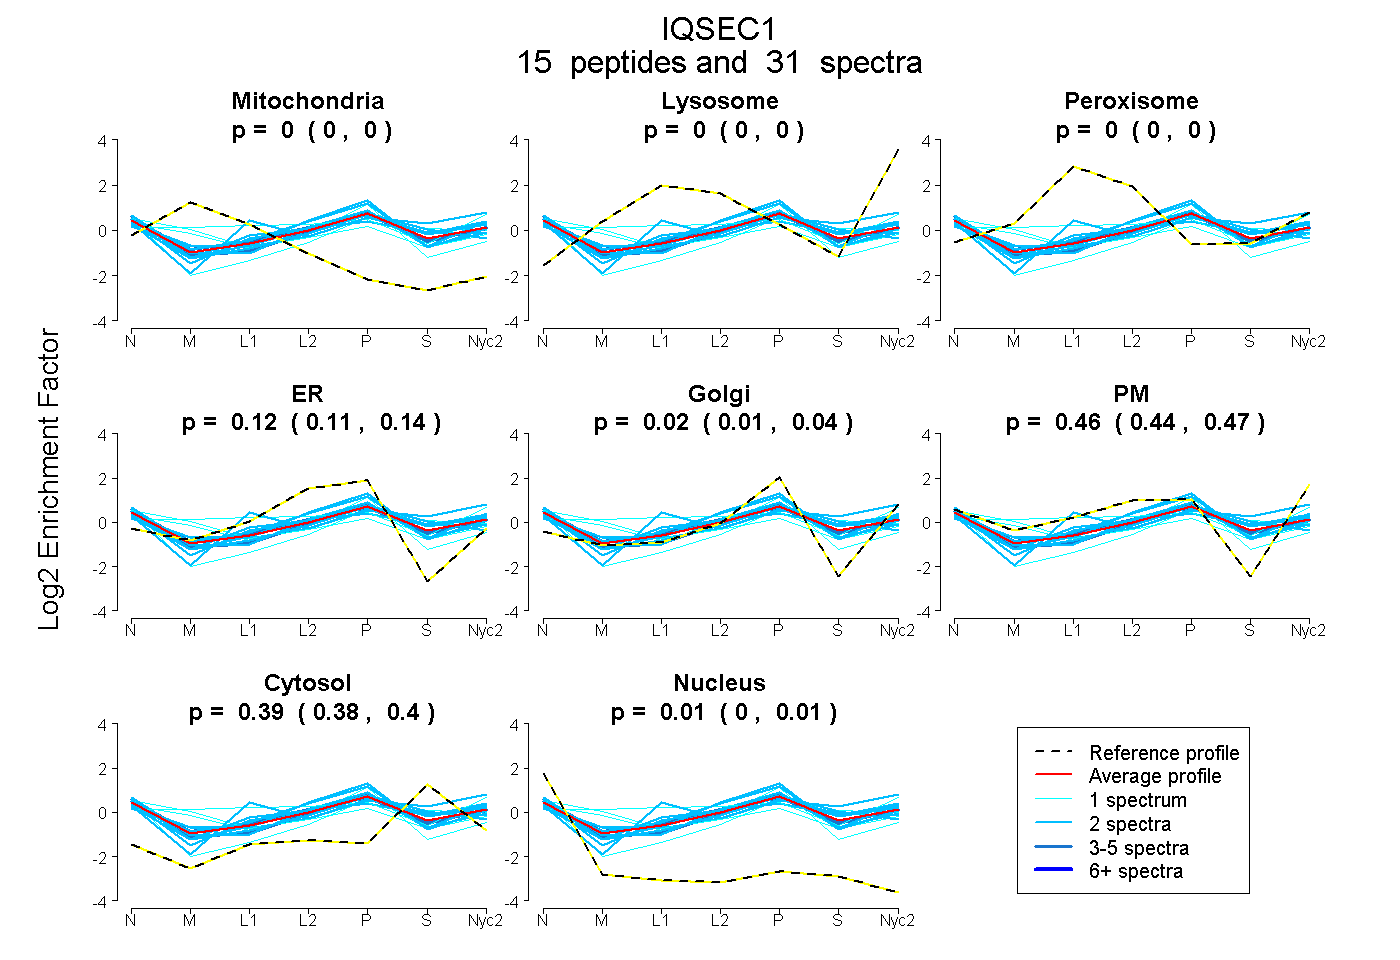
0.000 | 0.000
0.000 | 0.000
0.000 | 0.000
0.110 | 0.136
0.006 | 0.037
0.442 | 0.466
0.383 | 0.395
0.004 | 0.011
2peptides
spectra
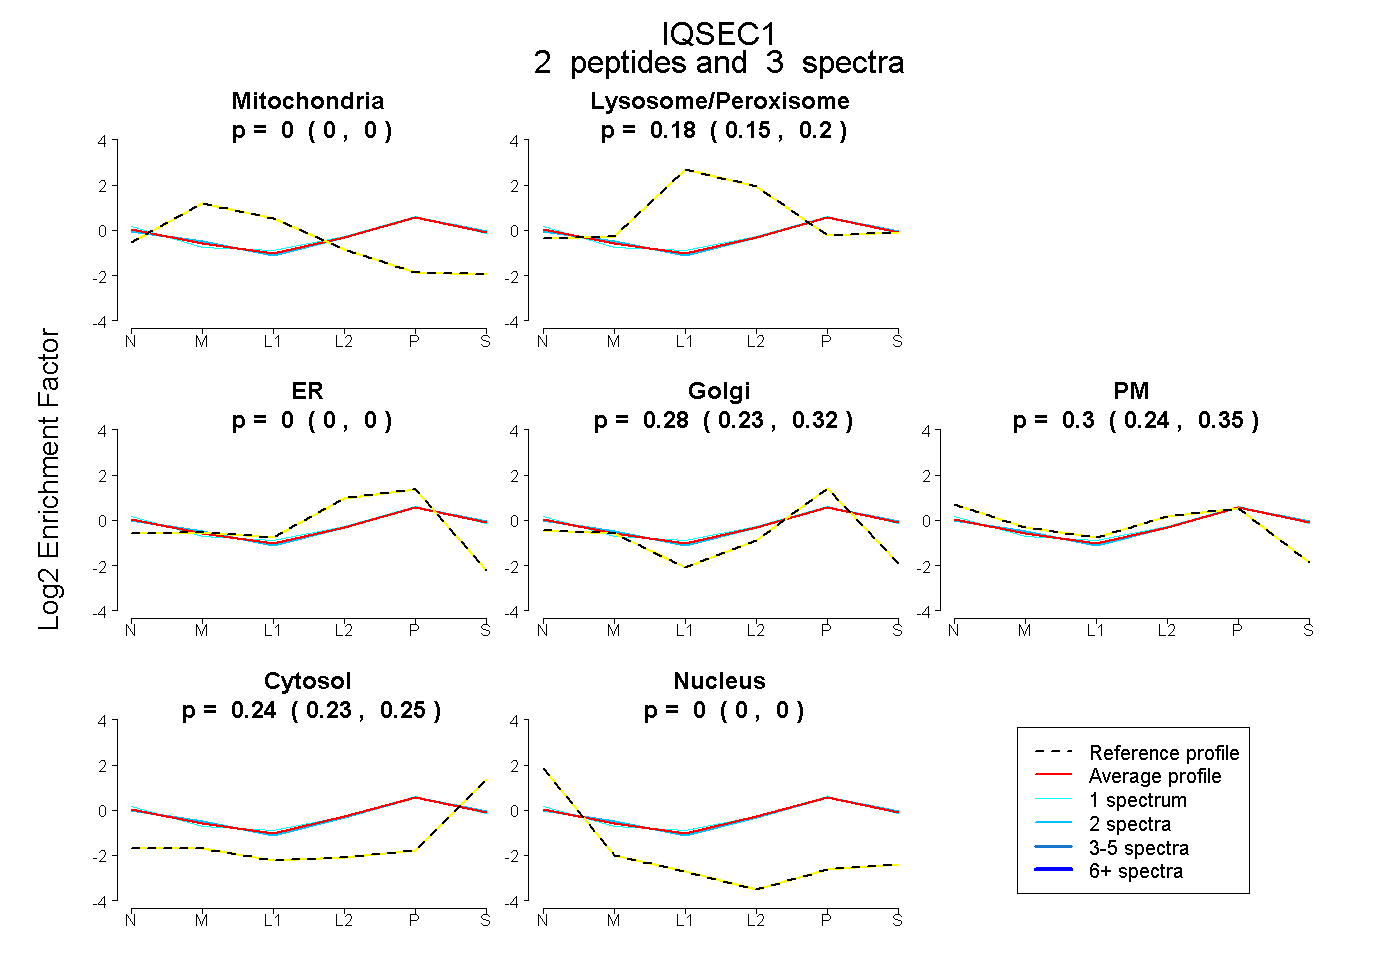
0.000 | 0.000
0.152 | 0.198
0.000 | 0.000
0.230 | 0.318
0.240 | 0.350
0.229 | 0.255
0.000 | 0.000
6peptides
spectra
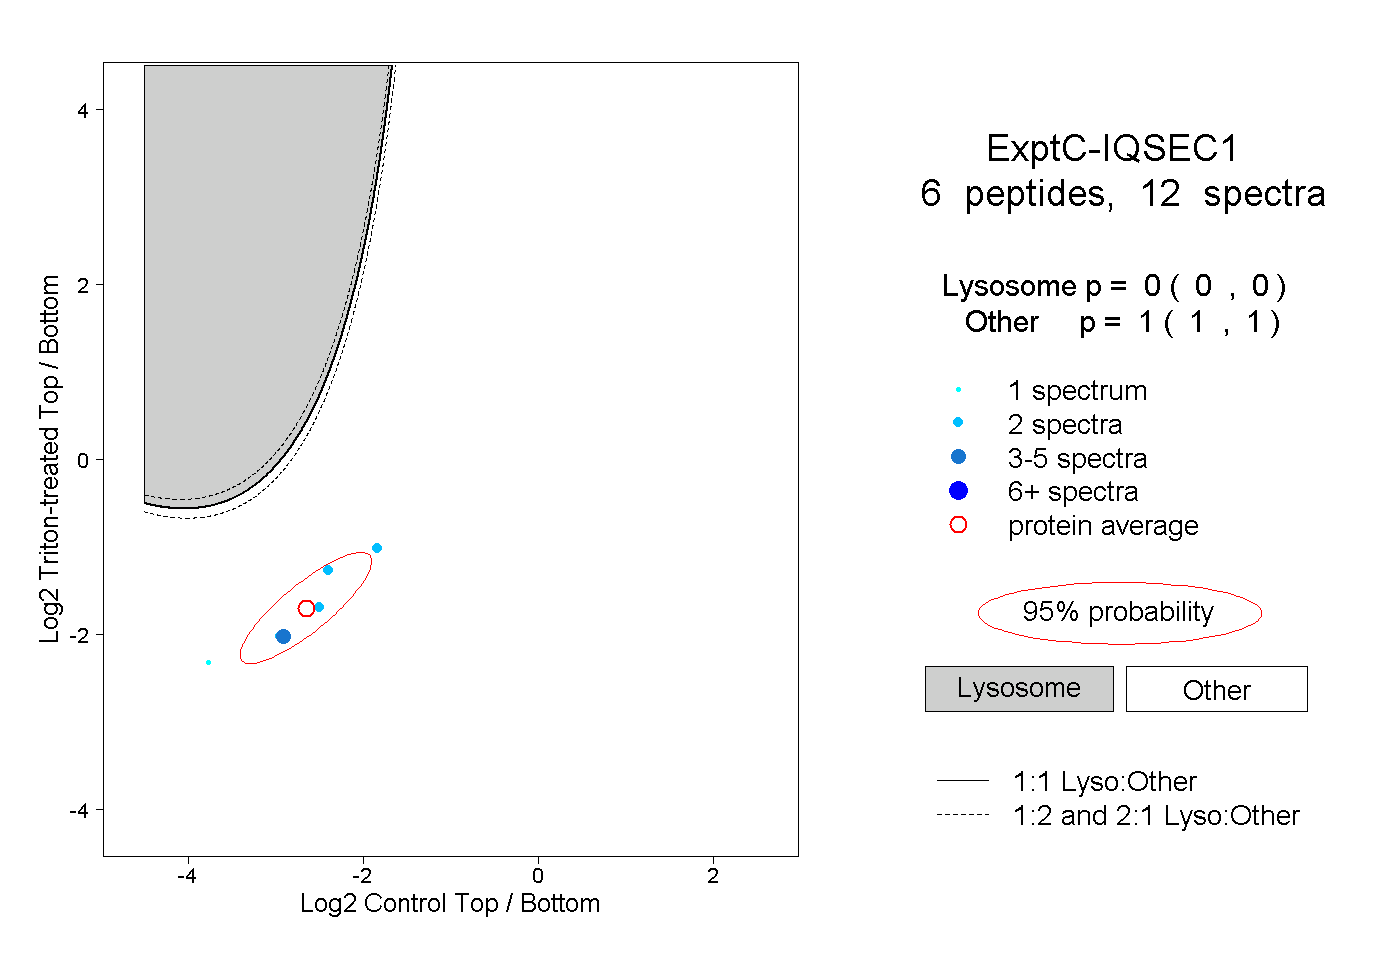
0.000 | 0.000
1.000 | 1.000