 15
15peptides
spectra
0.000 | 0.000
0.000 | 0.000
0.000 | 0.000
0.110 | 0.136
0.006 | 0.037
0.442 | 0.466
0.383 | 0.395
0.004 | 0.011
| Plot | Mito | Lyso | Perox | ER | Golgi | PM | Cytosol | Nucleus | |||||
| Expt A |
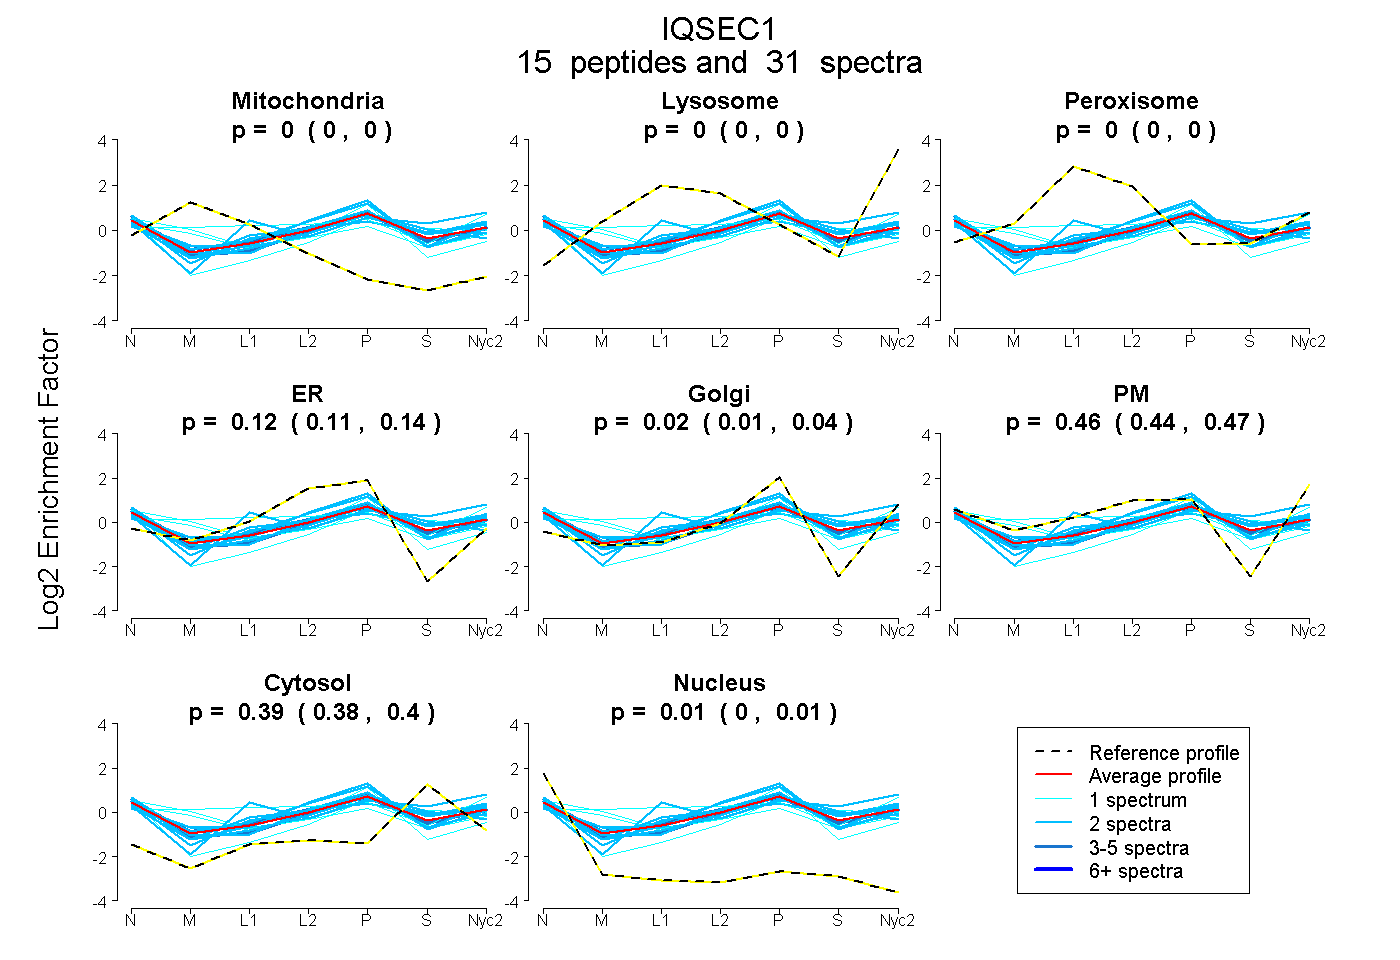
15 peptides |
31 spectra |
|
0.000 0.000 | 0.000 |
0.000 0.000 | 0.000 |
0.000 0.000 | 0.000 |
0.124 0.110 | 0.136 |
0.022 0.006 | 0.037 |
0.456 0.442 | 0.466 |
0.390 0.383 | 0.395 |
0.008 0.004 | 0.011 |
| 2 spectra, QSAYER | 0.000 | 0.000 | 0.126 | 0.000 | 0.000 | 0.429 | 0.445 | 0.000 | ||
| 2 spectra, GIQYLIER | 0.000 | 0.000 | 0.000 | 0.370 | 0.015 | 0.310 | 0.305 | 0.000 | ||
| 2 spectra, LGLHQR | 0.000 | 0.000 | 0.077 | 0.292 | 0.000 | 0.196 | 0.436 | 0.000 | ||
| 1 spectrum, ADTDTSCR | 0.000 | 0.000 | 0.000 | 0.000 | 0.244 | 0.221 | 0.477 | 0.057 | ||
| 1 spectrum, ESVAEVQEMEK | 0.178 | 0.000 | 0.000 | 0.189 | 0.414 | 0.054 | 0.155 | 0.010 | ||
| 4 spectra, GFVPDTPVGVAHFLLQR | 0.000 | 0.000 | 0.008 | 0.151 | 0.000 | 0.460 | 0.364 | 0.016 | ||
| 1 spectrum, LEDFVK | 0.223 | 0.000 | 0.000 | 0.000 | 0.080 | 0.412 | 0.273 | 0.012 | ||
| 2 spectra, VLINFNAPNPQDR | 0.000 | 0.000 | 0.000 | 0.006 | 0.130 | 0.440 | 0.414 | 0.010 | ||
| 1 spectrum, LTSAVPGADIK | 0.058 | 0.000 | 0.232 | 0.000 | 0.084 | 0.418 | 0.208 | 0.000 | ||
| 2 spectra, QMIGEFLGNR | 0.000 | 0.000 | 0.000 | 0.311 | 0.145 | 0.272 | 0.273 | 0.000 | ||
| 5 spectra, IESELEK | 0.000 | 0.000 | 0.000 | 0.055 | 0.153 | 0.403 | 0.342 | 0.046 | ||
| 2 spectra, STPSLERPEPR | 0.000 | 0.000 | 0.000 | 0.076 | 0.000 | 0.487 | 0.437 | 0.000 | ||
| 2 spectra, HGPHGGPPK | 0.044 | 0.000 | 0.000 | 0.094 | 0.070 | 0.357 | 0.435 | 0.000 | ||
| 2 spectra, IGLNLFNK | 0.000 | 0.000 | 0.000 | 0.000 | 0.000 | 0.559 | 0.435 | 0.006 | ||
| 2 spectra, LIEAFSQR | 0.000 | 0.000 | 0.000 | 0.003 | 0.195 | 0.473 | 0.290 | 0.039 |
| Plot | Mito | Lyso or Perox | ER | Golgi | PM | Cytosol | Nucleus | ||||||
| Expt B |
2 peptides |
3 spectra |
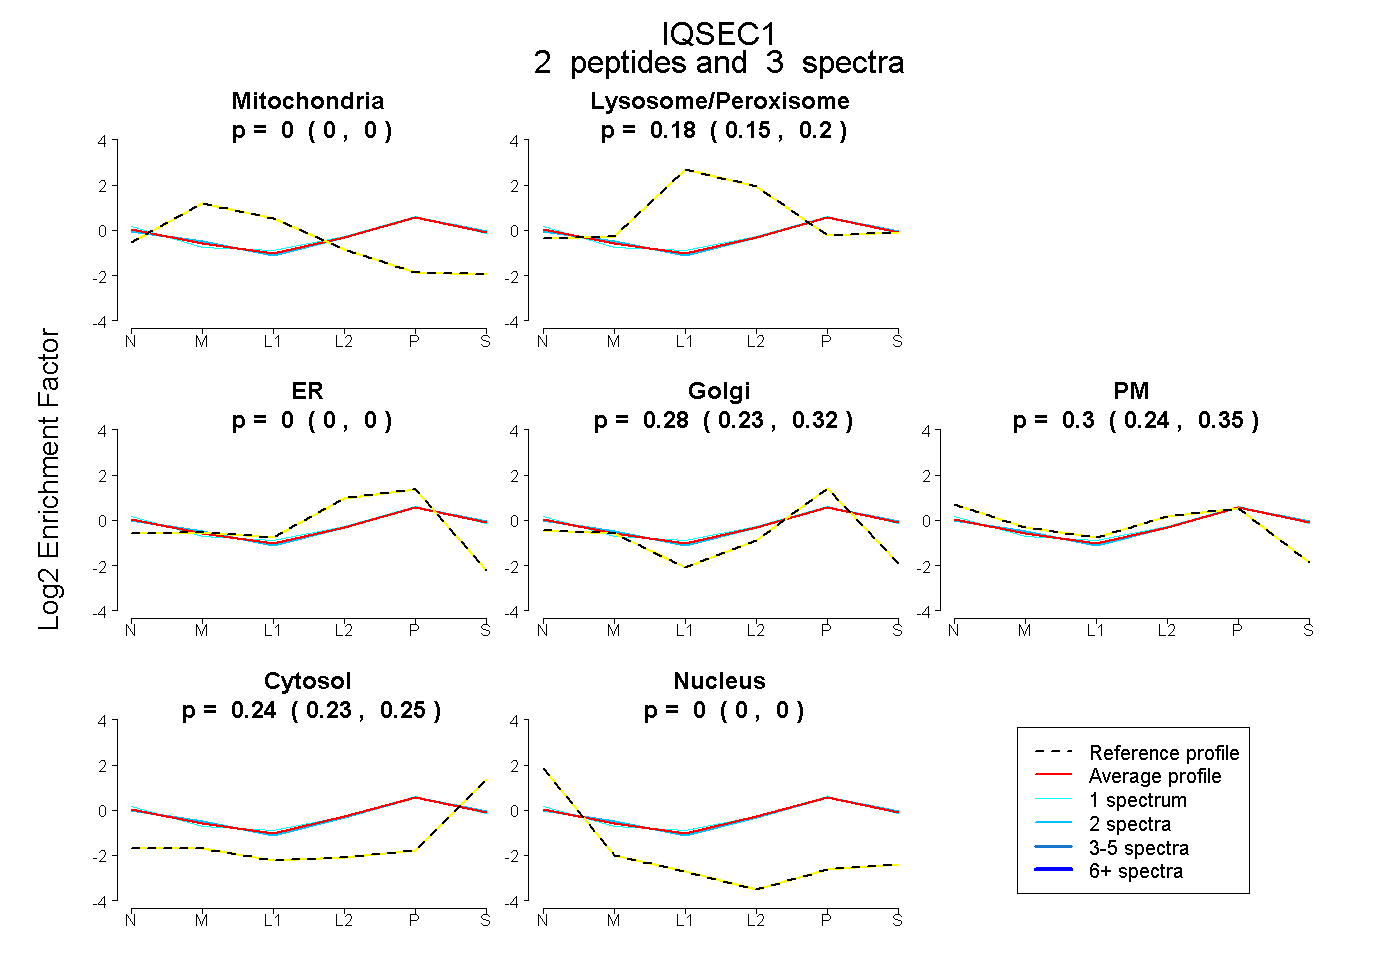 |
0.000 0.000 | 0.000 |
0.177 0.152 | 0.198 |
0.000 0.000 | 0.000 |
0.280 0.230 | 0.318 |
0.300 0.240 | 0.350 |
0.243 0.229 | 0.255 |
0.000 0.000 | 0.000 |
|||
| Plot | Lyso | Other | |||||||||||
| Expt C |
6 peptides |
12 spectra |
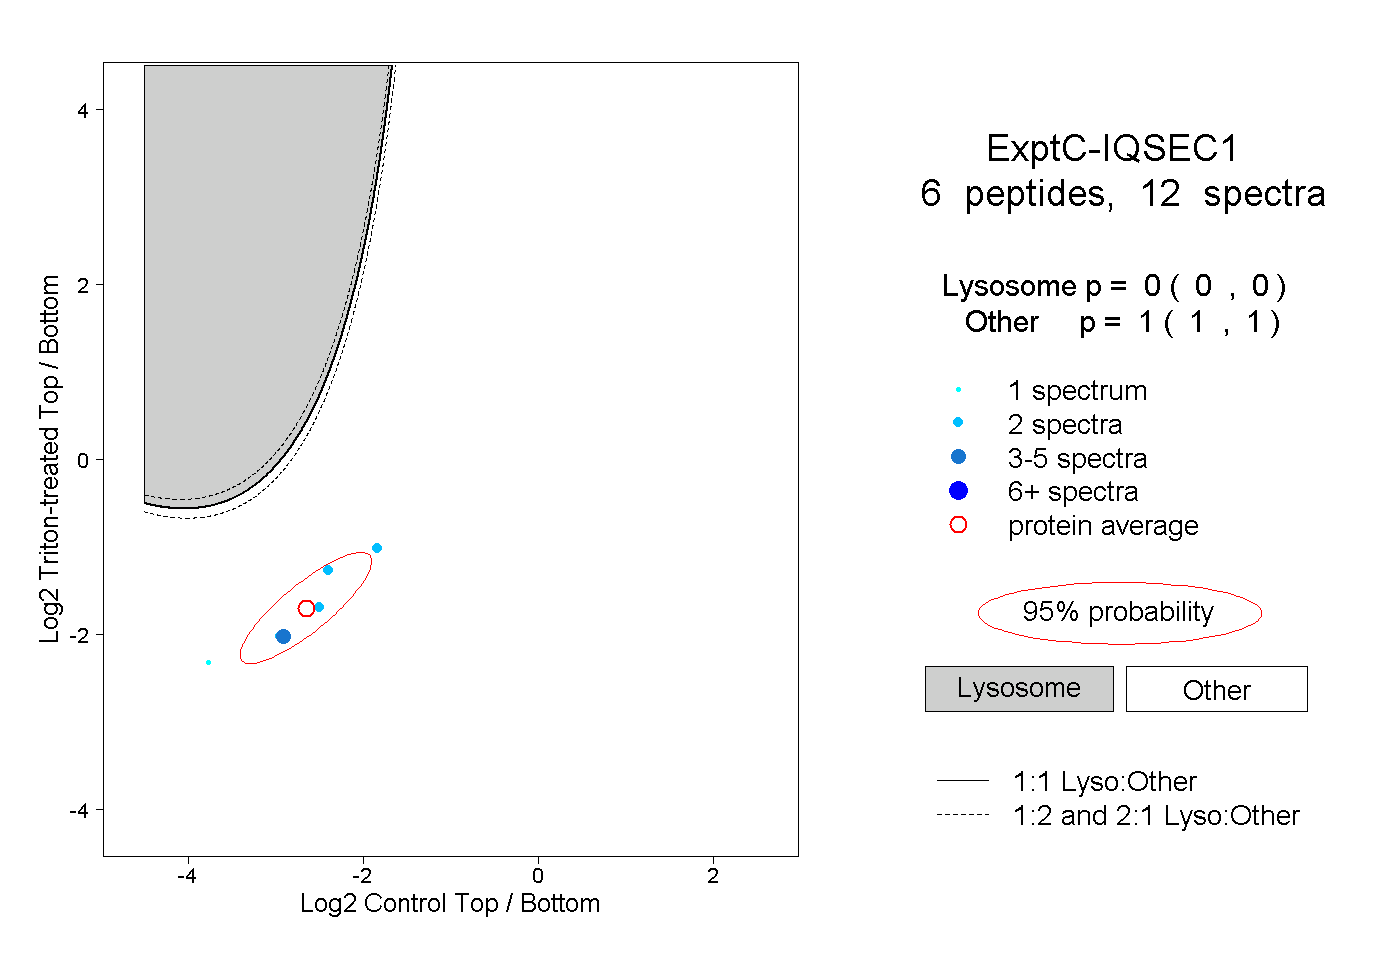 |
0.000 0.000 | 0.000 |
1.000 1.000 | 1.000 |