 4
4peptides
spectra
0.000 | 0.000
0.000 | 0.000
0.000 | 0.088
0.000 | 0.088
0.154 | 0.330
0.011 | 0.197
0.537 | 0.597
0.000 | 0.000
1peptide
spectra
NA | NA
NA | NA
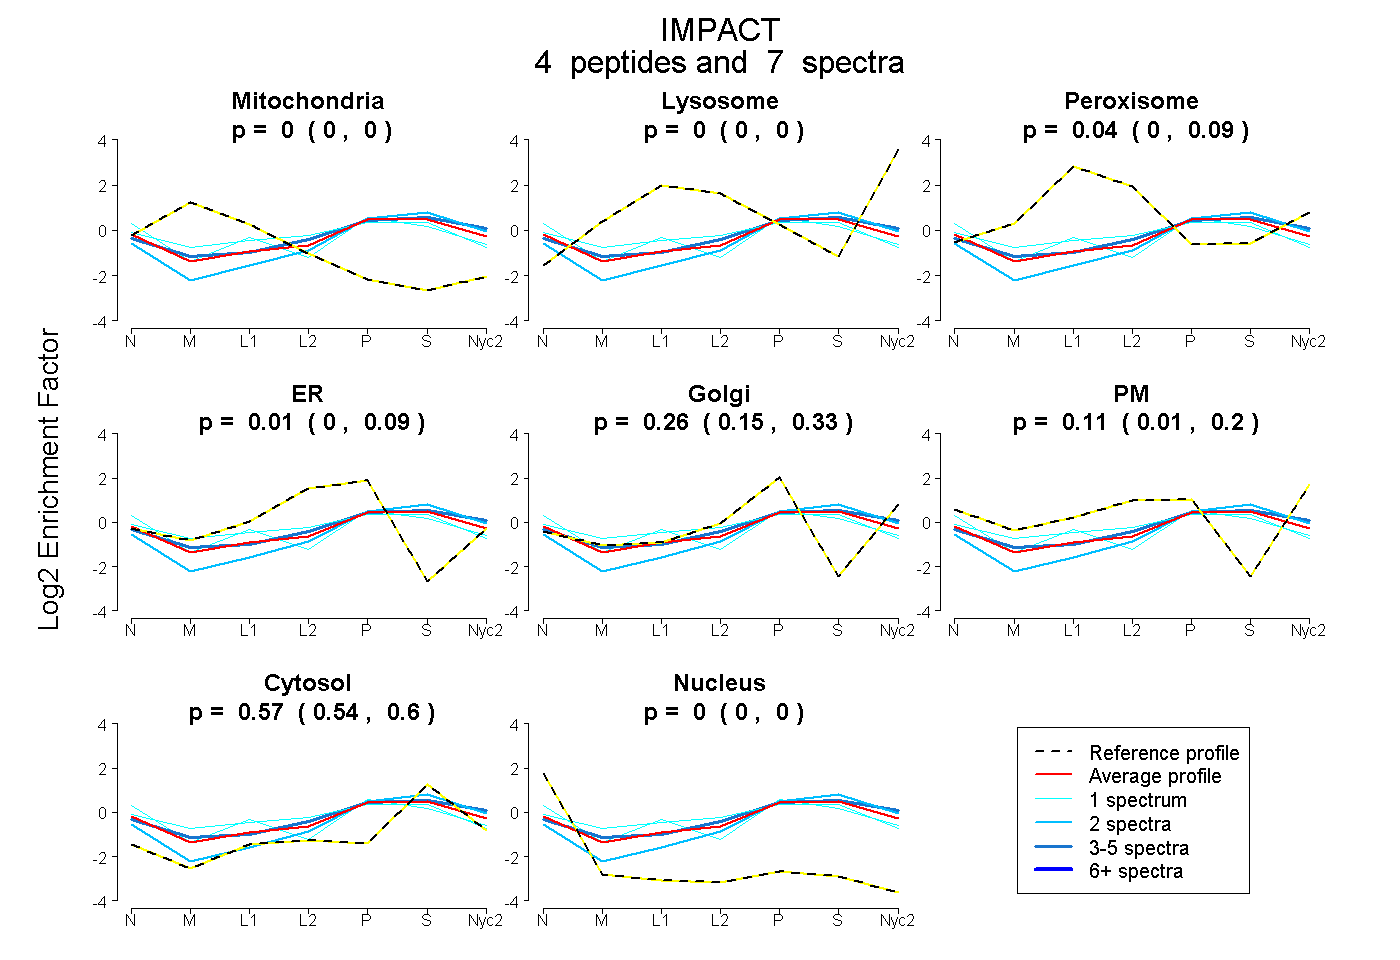
| Plot | Mito | Lyso | Perox | ER | Golgi | PM | Cytosol | Nucleus | |||||
| Expt A |
4 peptides |
7 spectra |
|
0.000 0.000 | 0.000 |
0.000 0.000 | 0.000 |
0.040 0.000 | 0.088 |
0.013 0.000 | 0.088 |
0.263 0.154 | 0.330 |
0.114 0.011 | 0.197 |
0.570 0.537 | 0.597 |
0.000 0.000 | 0.000 |
||
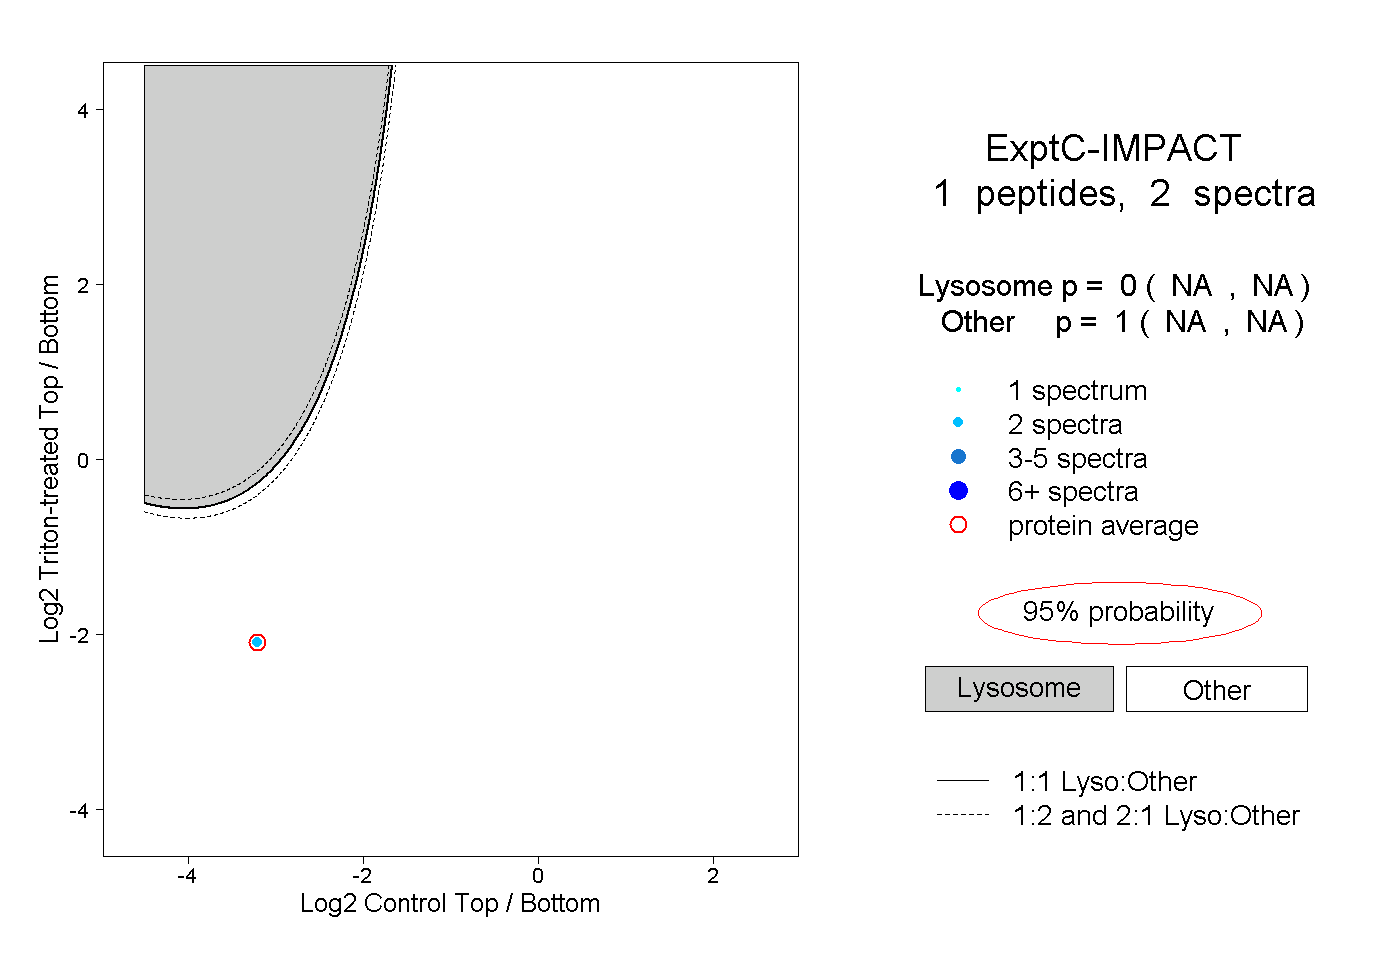
| Plot | Lyso | Other | |||||||||||
| Expt C |
1 peptide |
2 spectra |
|
0.000 NA | NA |
1.000 NA | NA |