 4
4peptides
spectra
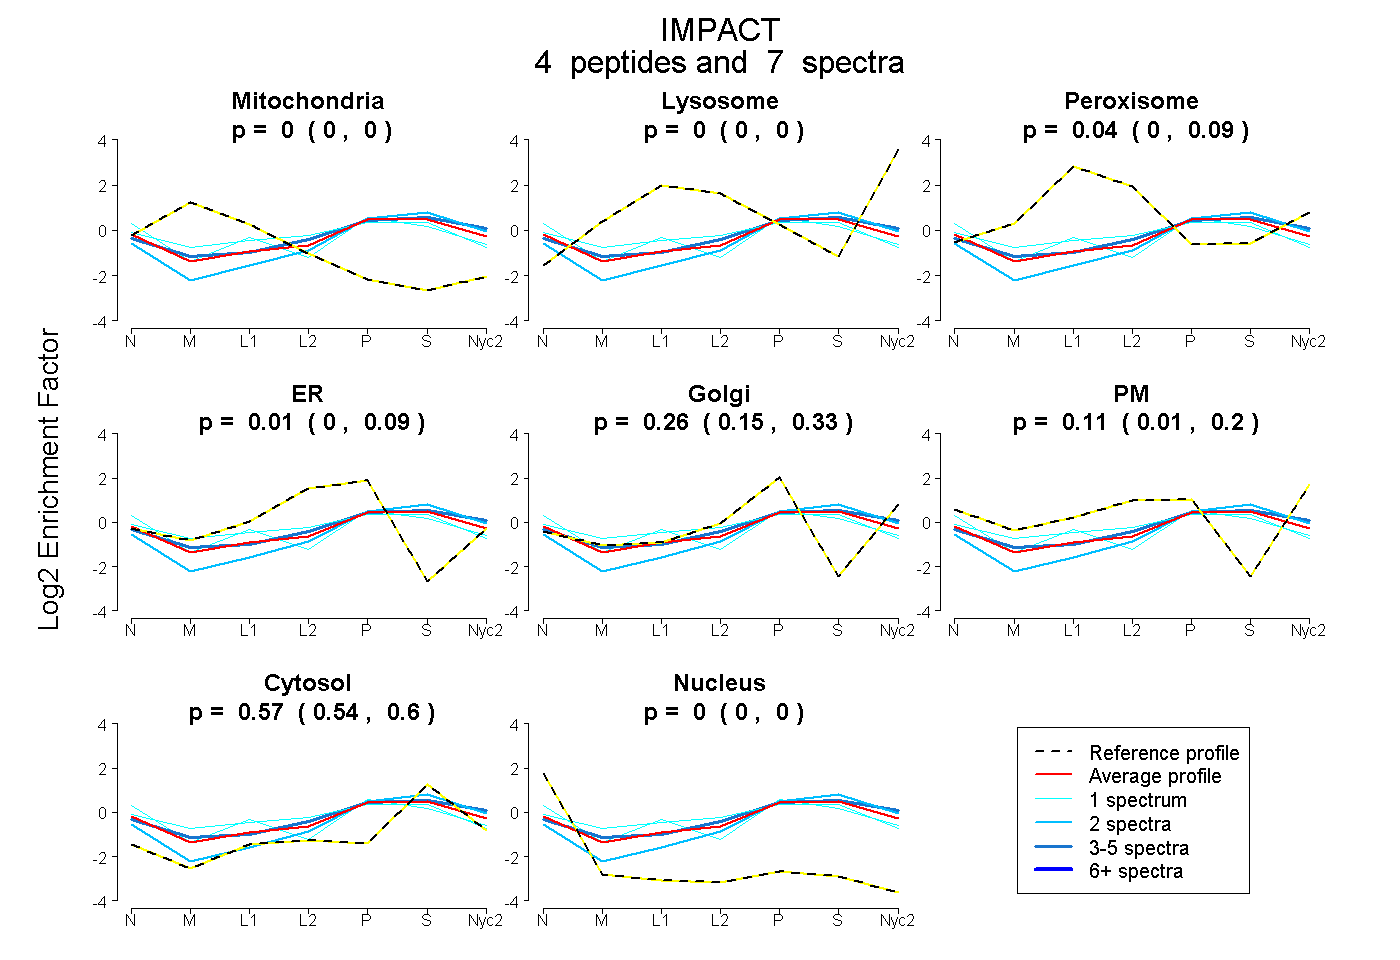
0.000 | 0.000
0.000 | 0.000
0.000 | 0.088
0.000 | 0.088
0.154 | 0.330
0.011 | 0.197
0.537 | 0.597
0.000 | 0.000
| Plot | Mito | Lyso | Perox | ER | Golgi | PM | Cytosol | Nucleus | |||||
| Expt A |
4 peptides |
7 spectra |
|
0.000 0.000 | 0.000 |
0.000 0.000 | 0.000 |
0.040 0.000 | 0.088 |
0.013 0.000 | 0.088 |
0.263 0.154 | 0.330 |
0.114 0.011 | 0.197 |
0.570 0.537 | 0.597 |
0.000 0.000 | 0.000 |
| 3 spectra, ITDDMDDPK | 0.000 | 0.000 | 0.053 | 0.000 | 0.214 | 0.185 | 0.549 | 0.000 | ||
| 1 spectrum, ISESAPEAEELPPIAHGAPITDR | 0.000 | 0.000 | 0.154 | 0.000 | 0.334 | 0.000 | 0.421 | 0.092 | ||
| 2 spectra, NFTNSPEESAK | 0.000 | 0.000 | 0.000 | 0.000 | 0.340 | 0.000 | 0.660 | 0.000 | ||
| 1 spectrum, SQITEPGPDEK | 0.057 | 0.000 | 0.135 | 0.219 | 0.094 | 0.011 | 0.483 | 0.000 |
| Plot | Lyso | Other | |||||||||||
| Expt C |
1 peptide |
2 spectra |
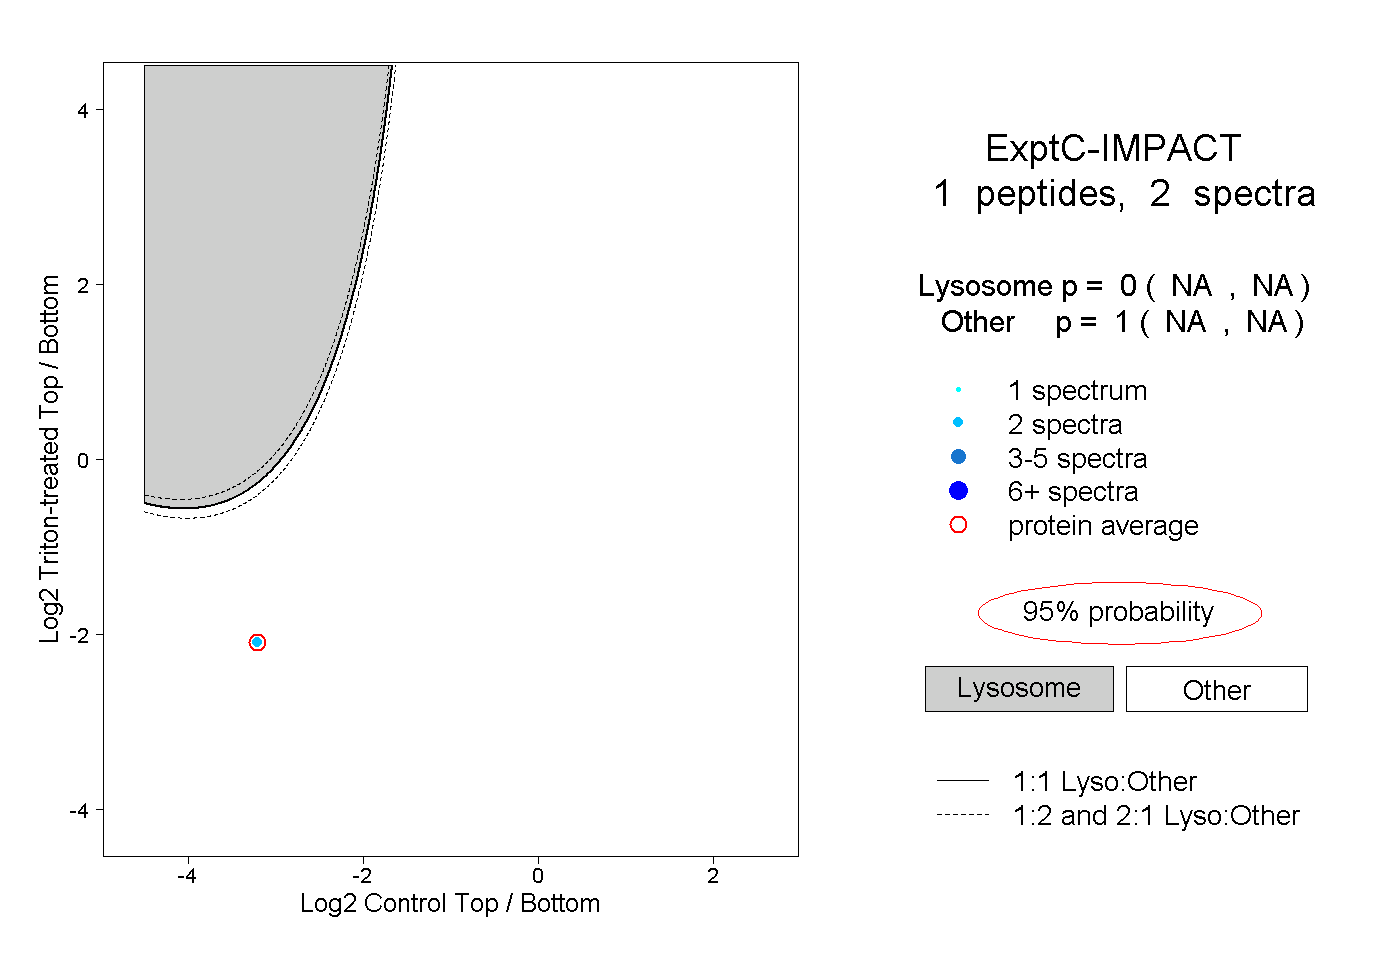 |
0.000 NA | NA |
1.000 NA | NA |