 15
15peptides
spectra

0.000 | 0.000
0.000 | 0.000
0.000 | 0.000
0.119 | 0.139
0.000 | 0.000
0.860 | 0.879
0.000 | 0.000
0.000 | 0.000
3peptides
spectra
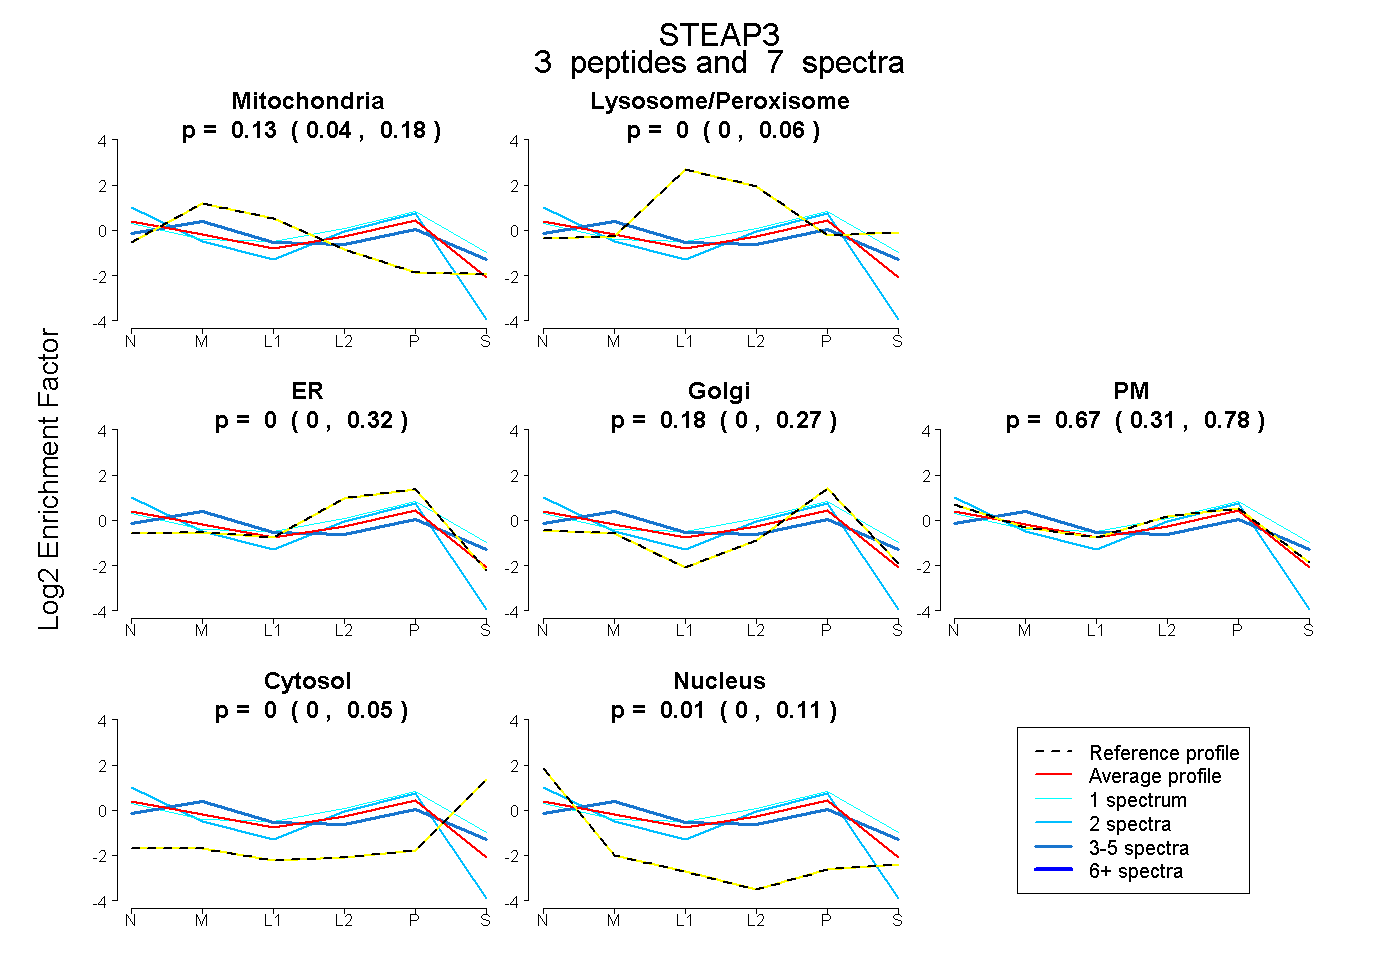
0.035 | 0.177
0.000 | 0.064
0.000 | 0.319
0.000 | 0.267
0.314 | 0.780
0.000 | 0.051
0.000 | 0.107
10peptides
spectra
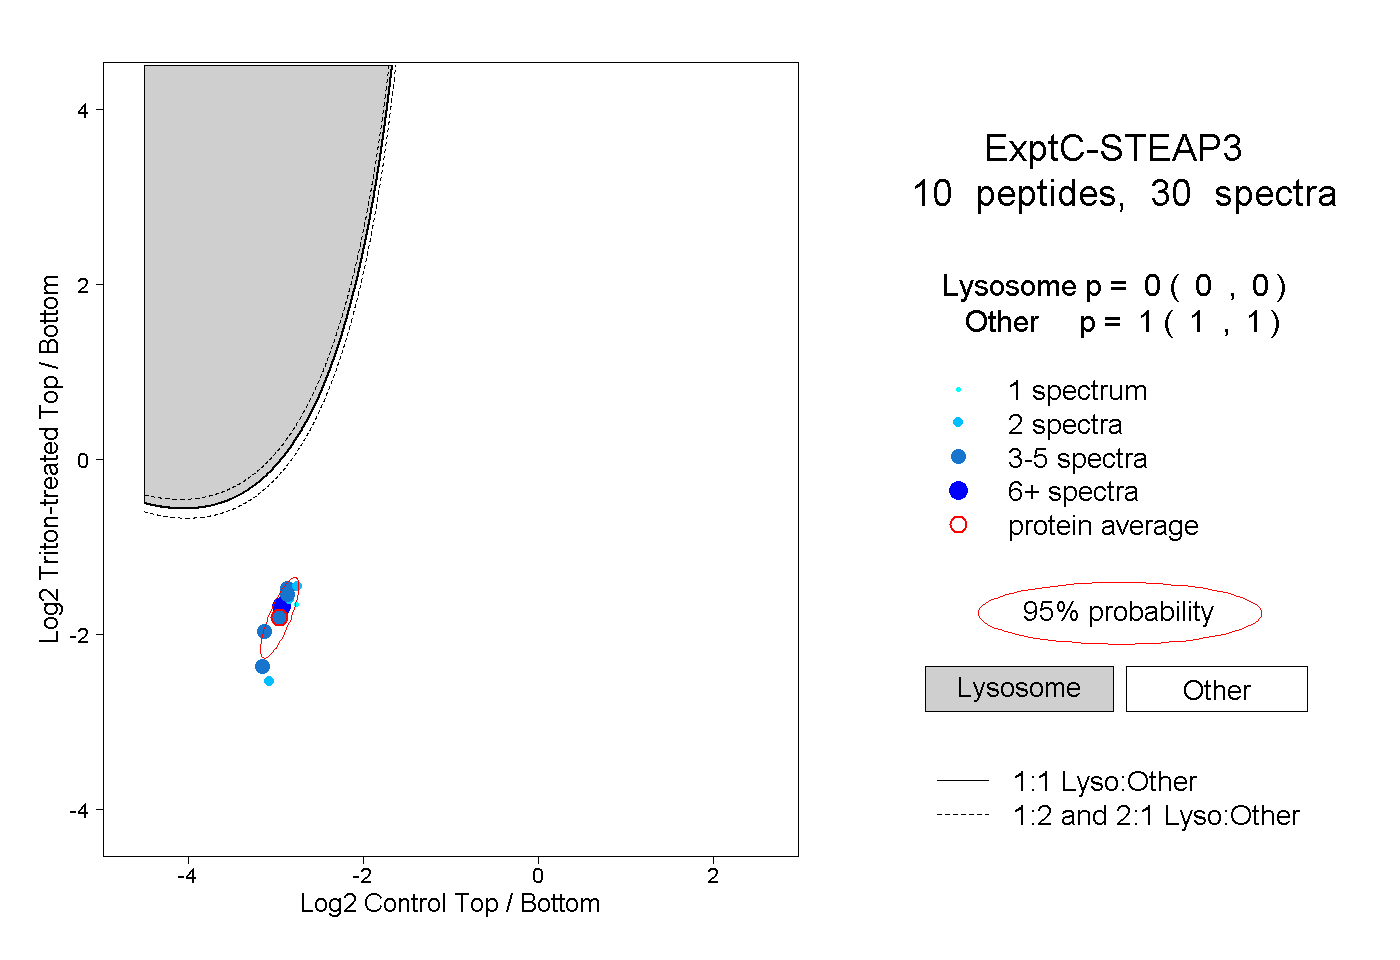
0.000 | 0.000
1.000 | 1.000
3peptides
spectra
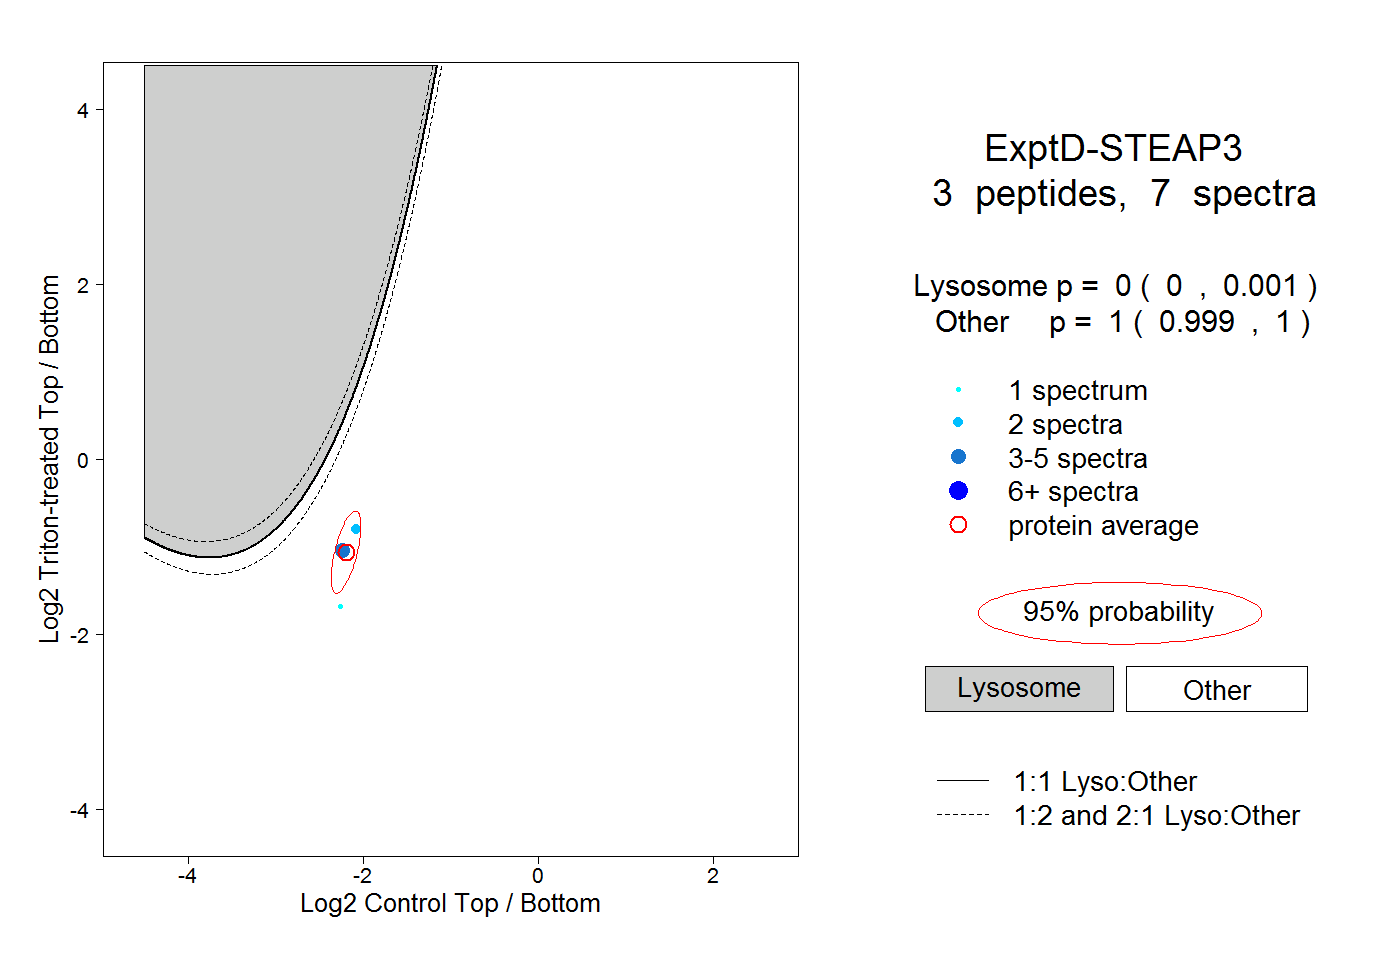
0.000 | 0.001
0.999 | 1.000