 15
15peptides
spectra

0.000 | 0.000
0.000 | 0.000
0.000 | 0.000
0.119 | 0.139
0.000 | 0.000
0.860 | 0.879
0.000 | 0.000
0.000 | 0.000
| Plot | Mito | Lyso | Perox | ER | Golgi | PM | Cytosol | Nucleus | |||||
| Expt A |
15 peptides |
47 spectra |
|
0.000 0.000 | 0.000 |
0.000 0.000 | 0.000 |
0.000 0.000 | 0.000 |
0.130 0.119 | 0.139 |
0.000 0.000 | 0.000 |
0.870 0.860 | 0.879 |
0.000 0.000 | 0.000 |
0.000 0.000 | 0.000 |
| 1 spectrum, QSNAEYLASLFPACTVVK | 0.144 | 0.000 | 0.000 | 0.251 | 0.000 | 0.606 | 0.000 | 0.000 | ||
| 2 spectra, AFEENHYK | 0.012 | 0.000 | 0.028 | 0.000 | 0.000 | 0.960 | 0.000 | 0.000 | ||
| 2 spectra, YDLVNLAVK | 0.000 | 0.009 | 0.018 | 0.044 | 0.000 | 0.906 | 0.023 | 0.000 | ||
| 8 spectra, EVEAIPLR | 0.000 | 0.000 | 0.000 | 0.088 | 0.000 | 0.912 | 0.000 | 0.000 | ||
| 5 spectra, FMLPAGHTQGEK | 0.000 | 0.000 | 0.050 | 0.098 | 0.000 | 0.835 | 0.018 | 0.000 | ||
| 1 spectrum, AMGFTPLDMGSLASAR | 0.000 | 0.004 | 0.000 | 0.000 | 0.000 | 0.996 | 0.000 | 0.000 | ||
| 2 spectra, FPDWLDHWLQHR | 0.000 | 0.000 | 0.000 | 0.156 | 0.000 | 0.844 | 0.000 | 0.000 | ||
| 7 spectra, HTVSEMAR | 0.000 | 0.043 | 0.092 | 0.000 | 0.000 | 0.785 | 0.080 | 0.000 | ||
| 2 spectra, ILVDVSNPTEK | 0.000 | 0.000 | 0.000 | 0.274 | 0.000 | 0.726 | 0.000 | 0.000 | ||
| 3 spectra, LLPSWK | 0.000 | 0.008 | 0.000 | 0.000 | 0.000 | 0.992 | 0.000 | 0.000 | ||
| 2 spectra, LVDSDGSLAEVPK | 0.000 | 0.000 | 0.000 | 0.257 | 0.000 | 0.743 | 0.000 | 0.000 | ||
| 2 spectra, VGILGSGDFAR | 0.000 | 0.000 | 0.000 | 0.089 | 0.000 | 0.911 | 0.000 | 0.000 | ||
| 2 spectra, QVLICGDQLEAK | 0.000 | 0.000 | 0.000 | 0.309 | 0.000 | 0.691 | 0.000 | 0.000 | ||
| 2 spectra, DVLQPYIR | 0.000 | 0.000 | 0.009 | 0.352 | 0.000 | 0.566 | 0.000 | 0.073 | ||
| 6 spectra, LVGSGFSVVVGSR | 0.000 | 0.000 | 0.000 | 0.067 | 0.000 | 0.933 | 0.000 | 0.000 |
| Plot | Mito | Lyso or Perox | ER | Golgi | PM | Cytosol | Nucleus | ||||||
| Expt B |
3 peptides |
7 spectra |
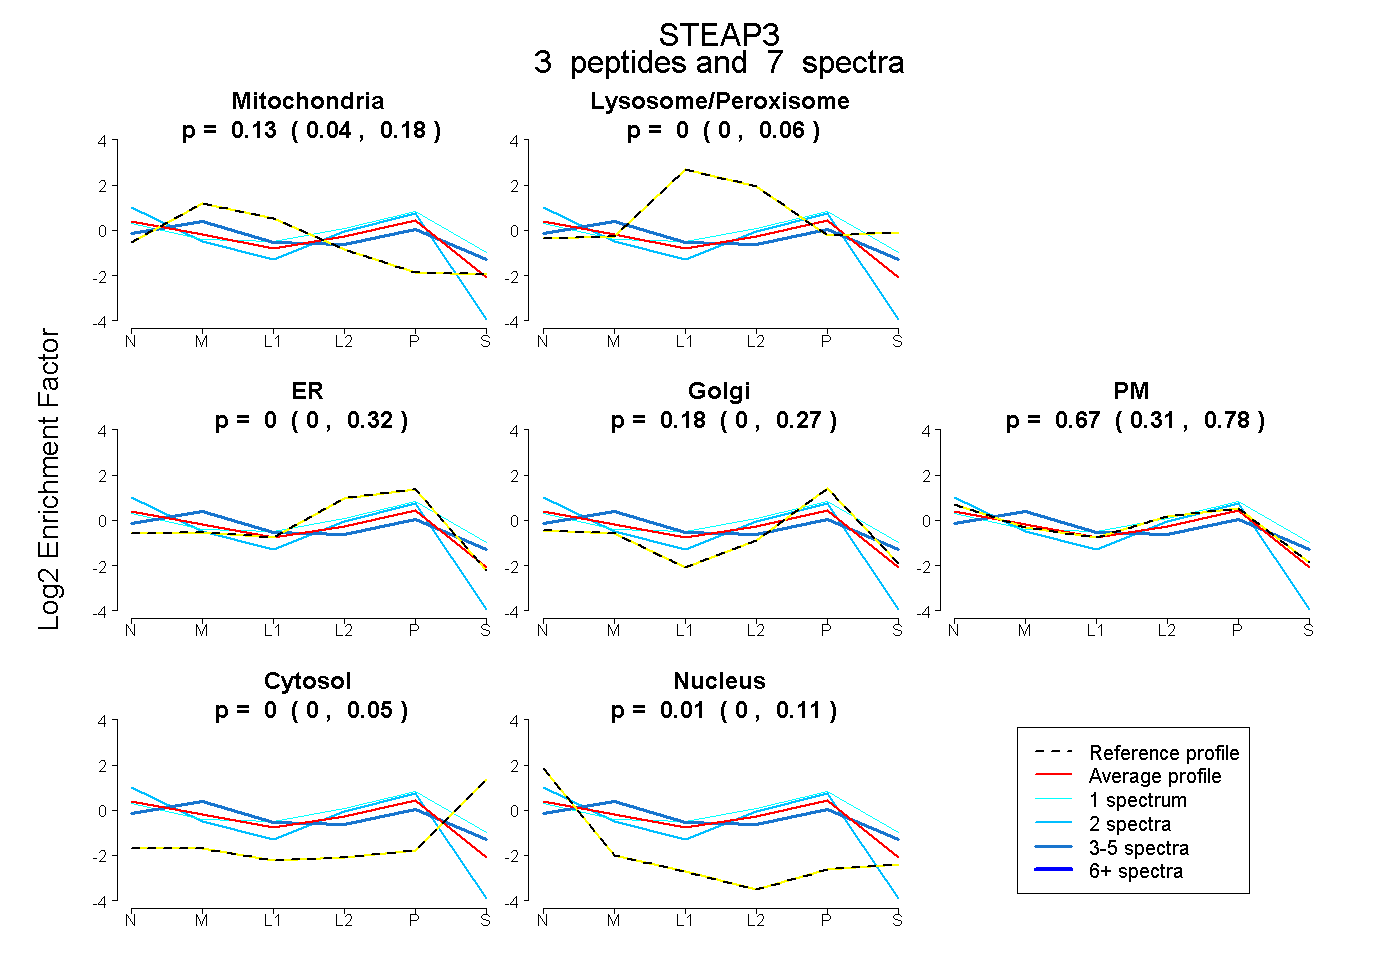 |
0.131 0.035 | 0.177 |
0.000 0.000 | 0.064 |
0.003 0.000 | 0.319 |
0.181 0.000 | 0.267 |
0.673 0.314 | 0.780 |
0.000 0.000 | 0.051 |
0.011 0.000 | 0.107 |
|||
| Plot | Lyso | Other | |||||||||||
| Expt C |
10 peptides |
30 spectra |
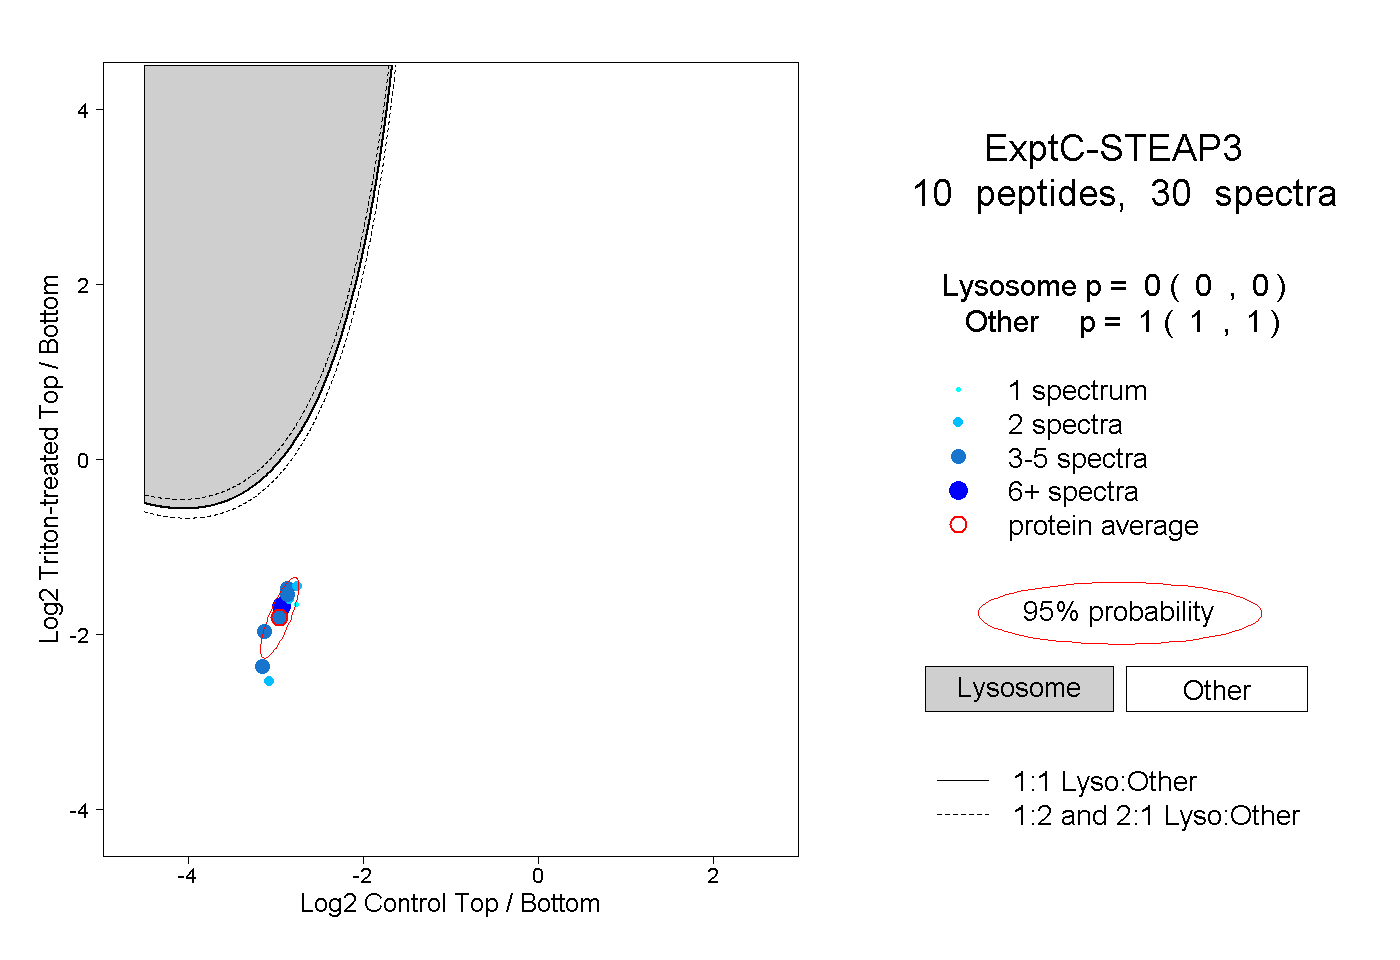 |
0.000 0.000 | 0.000 |
1.000 1.000 | 1.000 |
||||||||
| Plot | Lyso | Other | |||||||||||
| Expt D |
3 peptides |
7 spectra |
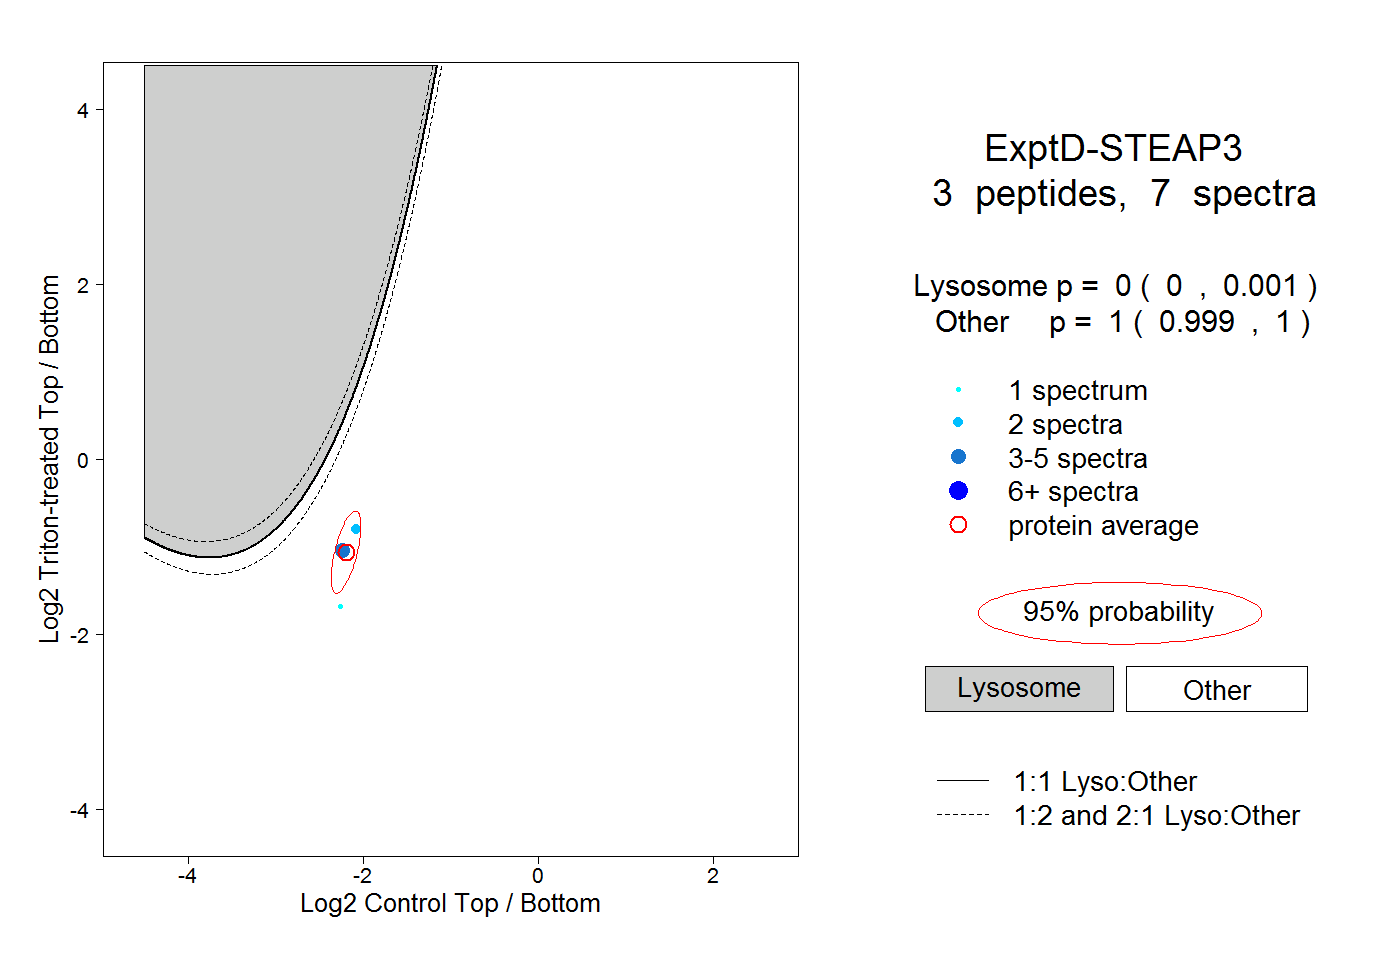 |
0.000 0.000 | 0.001 |
1.000 0.999 | 1.000 |