 2
2peptides
spectra
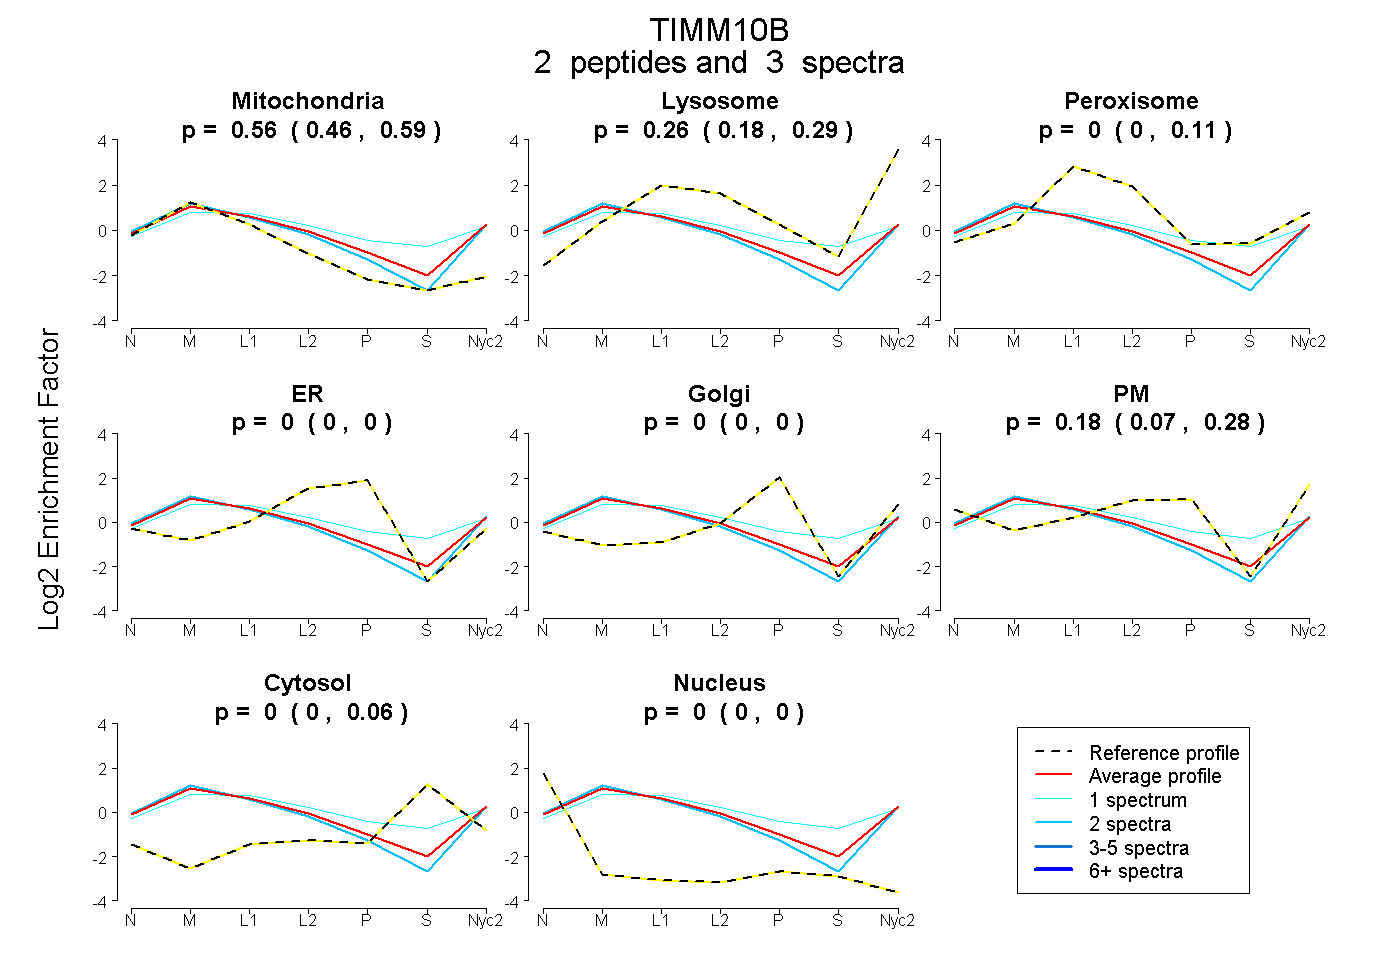
0.460 | 0.587
0.175 | 0.287
0.000 | 0.107
0.000 | 0.000
0.000 | 0.000
0.070 | 0.275
0.000 | 0.059
0.000 | 0.000
1peptide
spectrum
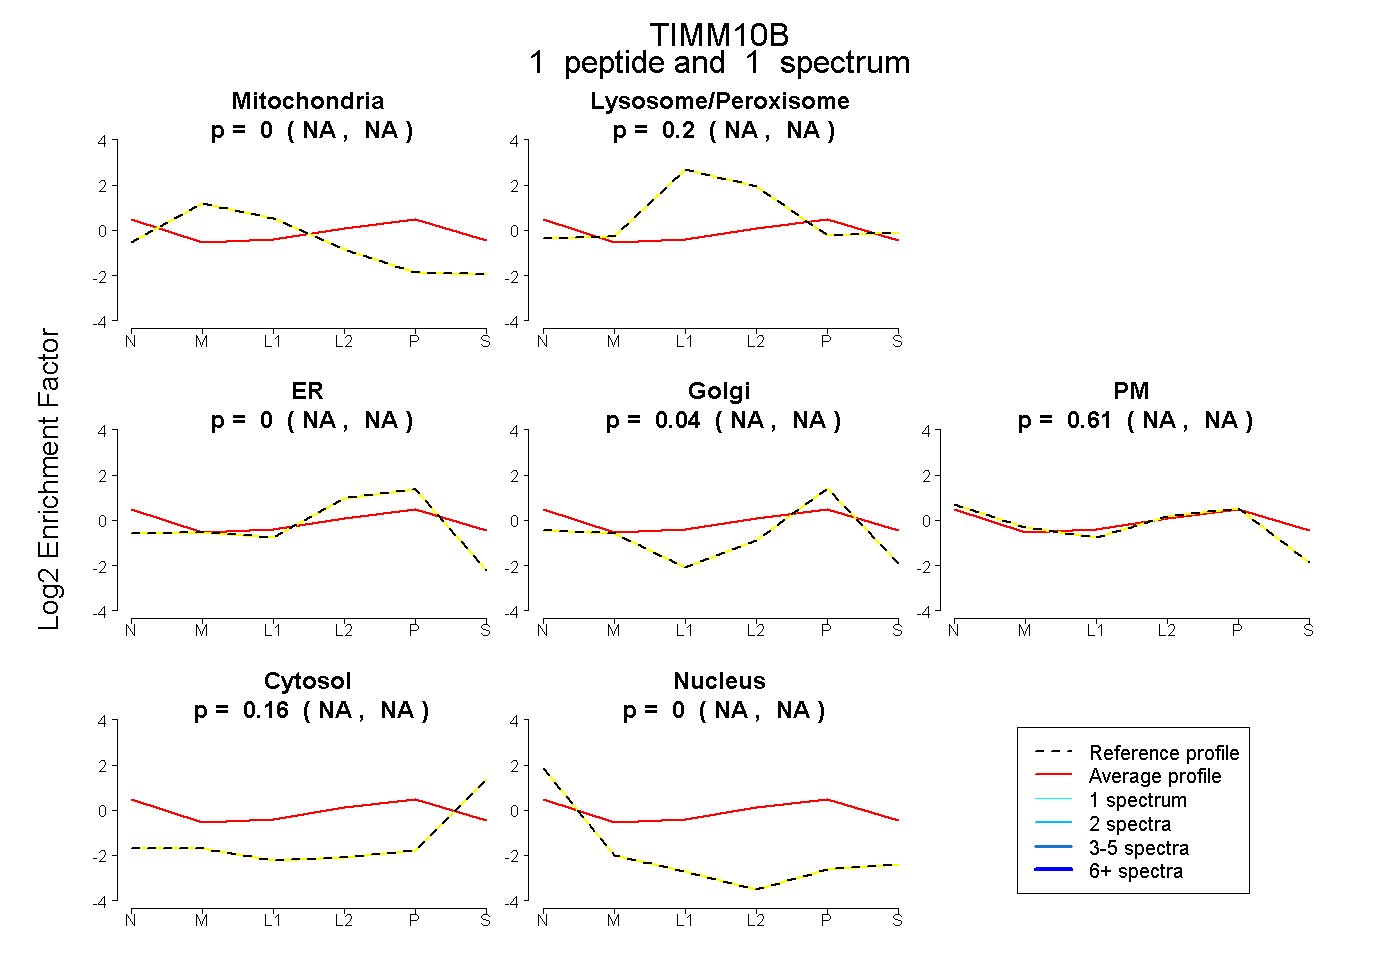
NA | NA
NA | NA
NA | NA
NA | NA
NA | NA
NA | NA
NA | NA
4peptides
spectra
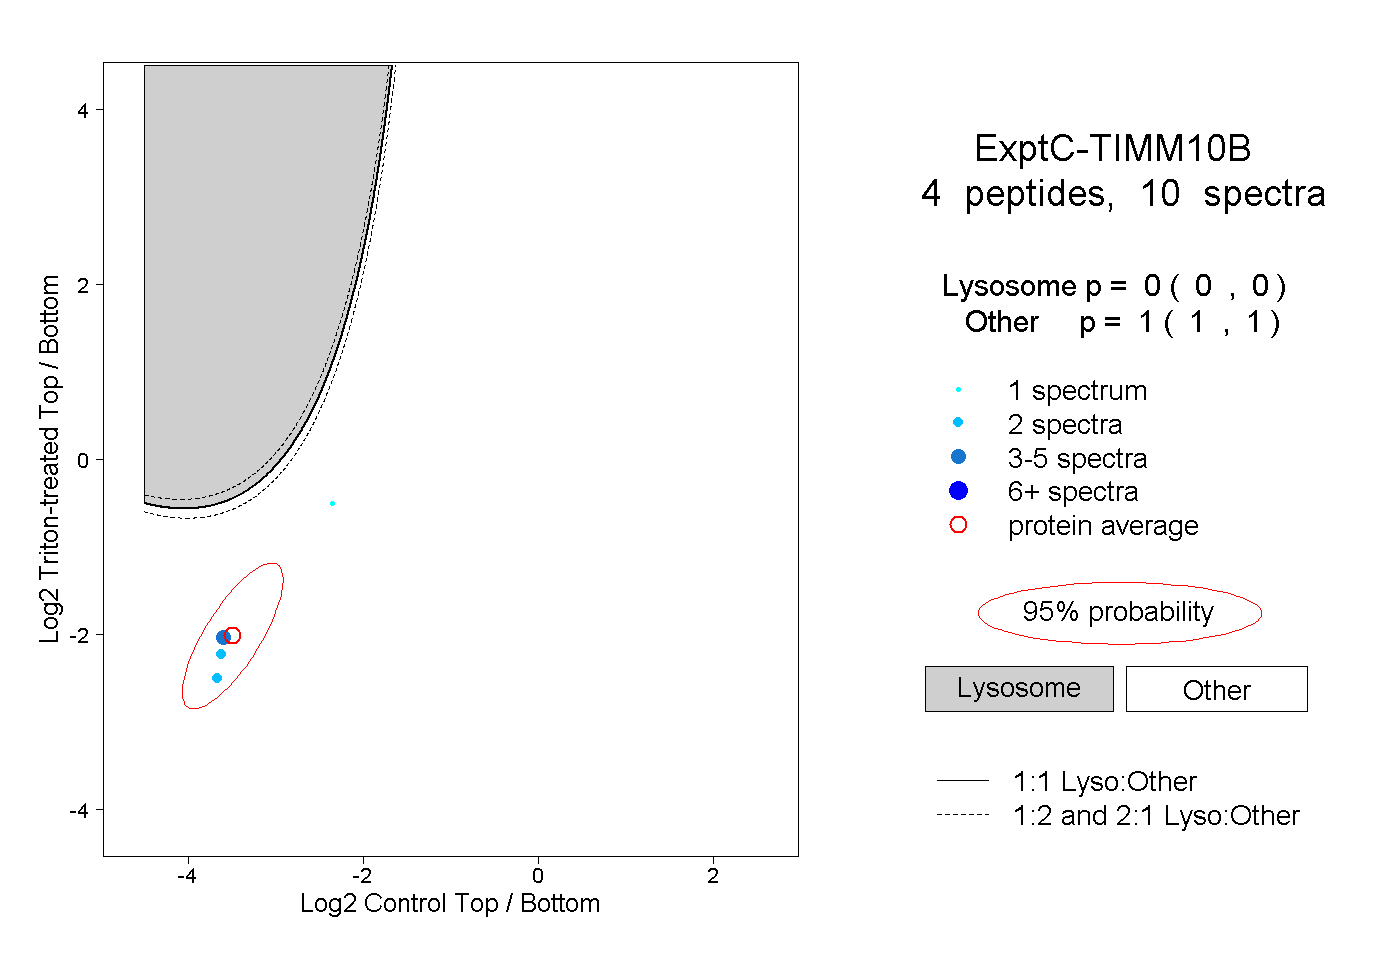
0.000 | 0.000
1.000 | 1.000