 2
2peptides
spectra
0.460 | 0.587
0.175 | 0.287
0.000 | 0.107
0.000 | 0.000
0.000 | 0.000
0.070 | 0.275
0.000 | 0.059
0.000 | 0.000
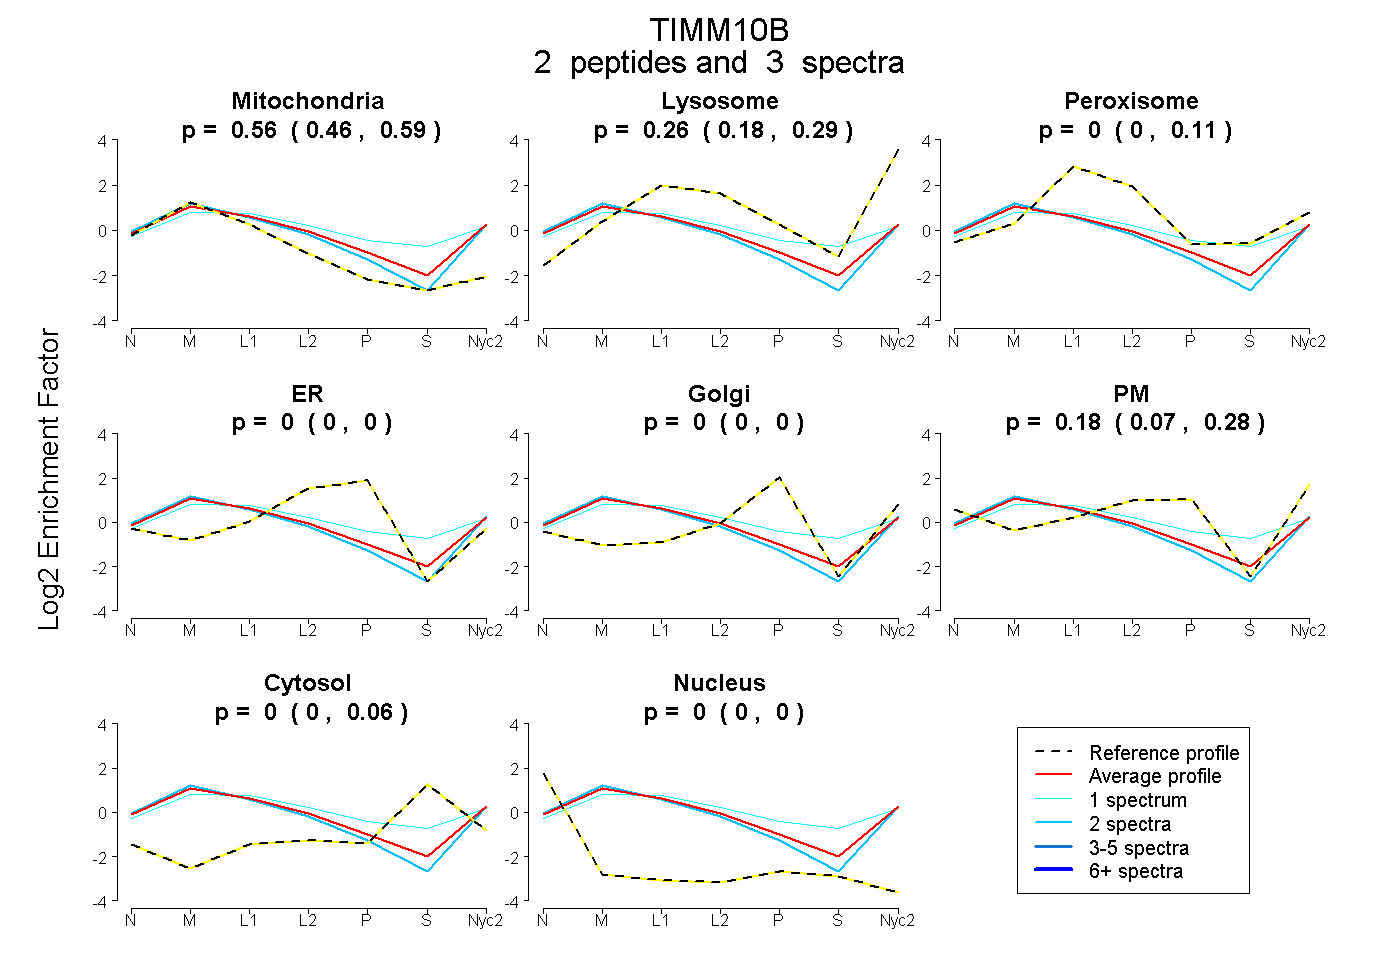
| Plot | Mito | Lyso | Perox | ER | Golgi | PM | Cytosol | Nucleus | |||||
| Expt A |
2 peptides |
3 spectra |
|
0.557 0.460 | 0.587 |
0.260 0.175 | 0.287 |
0.000 0.000 | 0.107 |
0.000 0.000 | 0.000 |
0.000 0.000 | 0.000 |
0.183 0.070 | 0.275 |
0.000 0.000 | 0.059 |
0.000 0.000 | 0.000 |
| 1 spectrum, MTELCFQR | 0.299 | 0.127 | 0.295 | 0.000 | 0.047 | 0.103 | 0.130 | 0.000 | ||
| 2 spectra, LMAAYVHLMPALVQR | 0.595 | 0.209 | 0.000 | 0.000 | 0.000 | 0.196 | 0.000 | 0.000 |
| Plot | Mito | Lyso or Perox | ER | Golgi | PM | Cytosol | Nucleus | ||||||
| Expt B |
1 peptide |
1 spectrum |
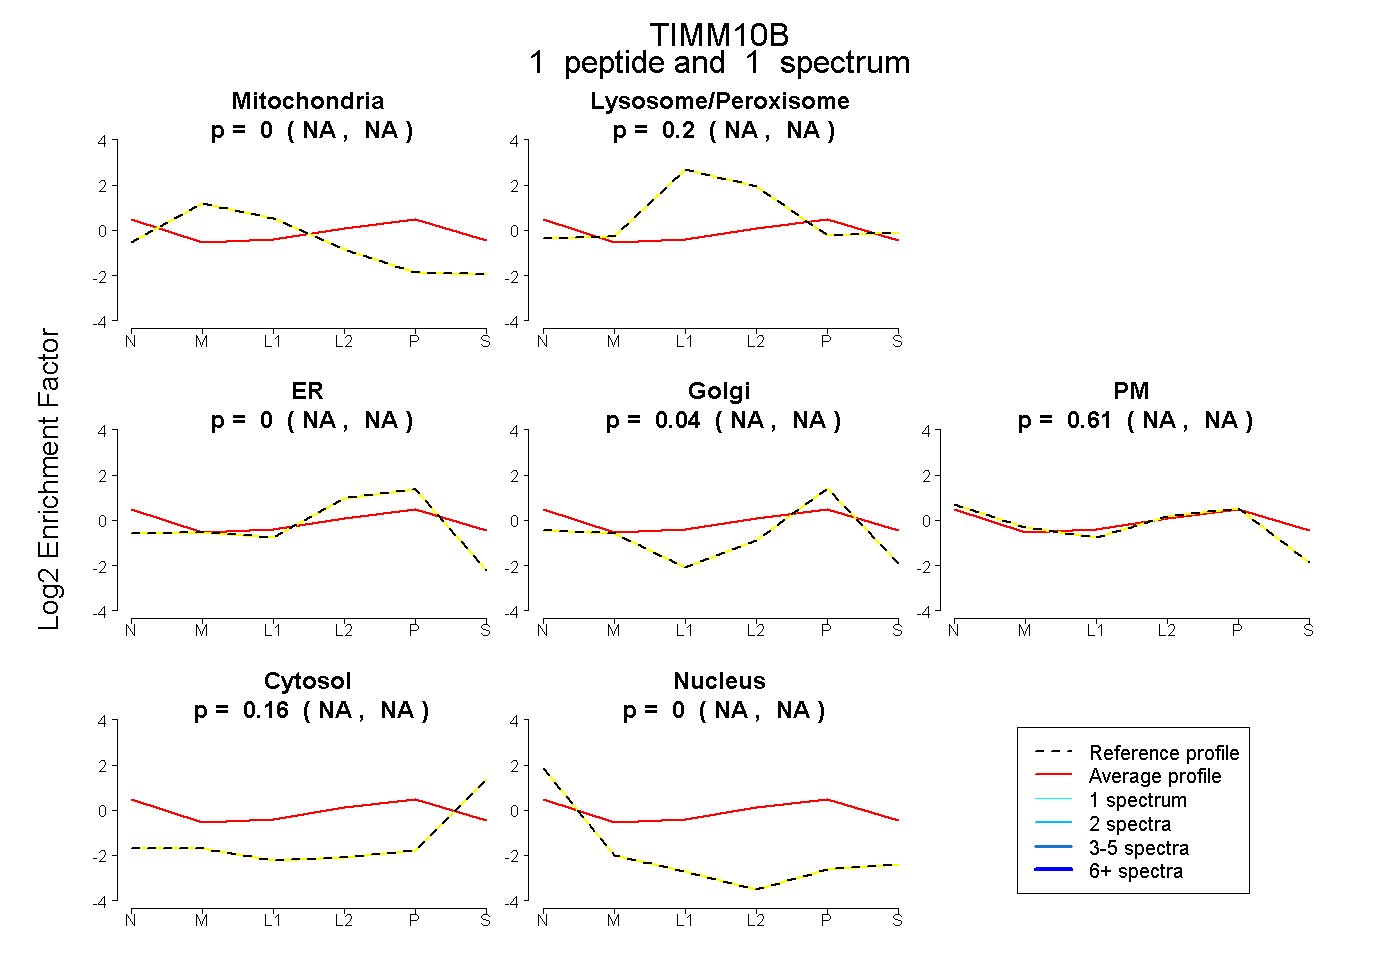 |
0.000 NA | NA |
0.199 NA | NA |
0.000 NA | NA |
0.040 NA | NA |
0.606 NA | NA |
0.155 NA | NA |
0.000 NA | NA |
|||
| Plot | Lyso | Other | |||||||||||
| Expt C |
4 peptides |
10 spectra |
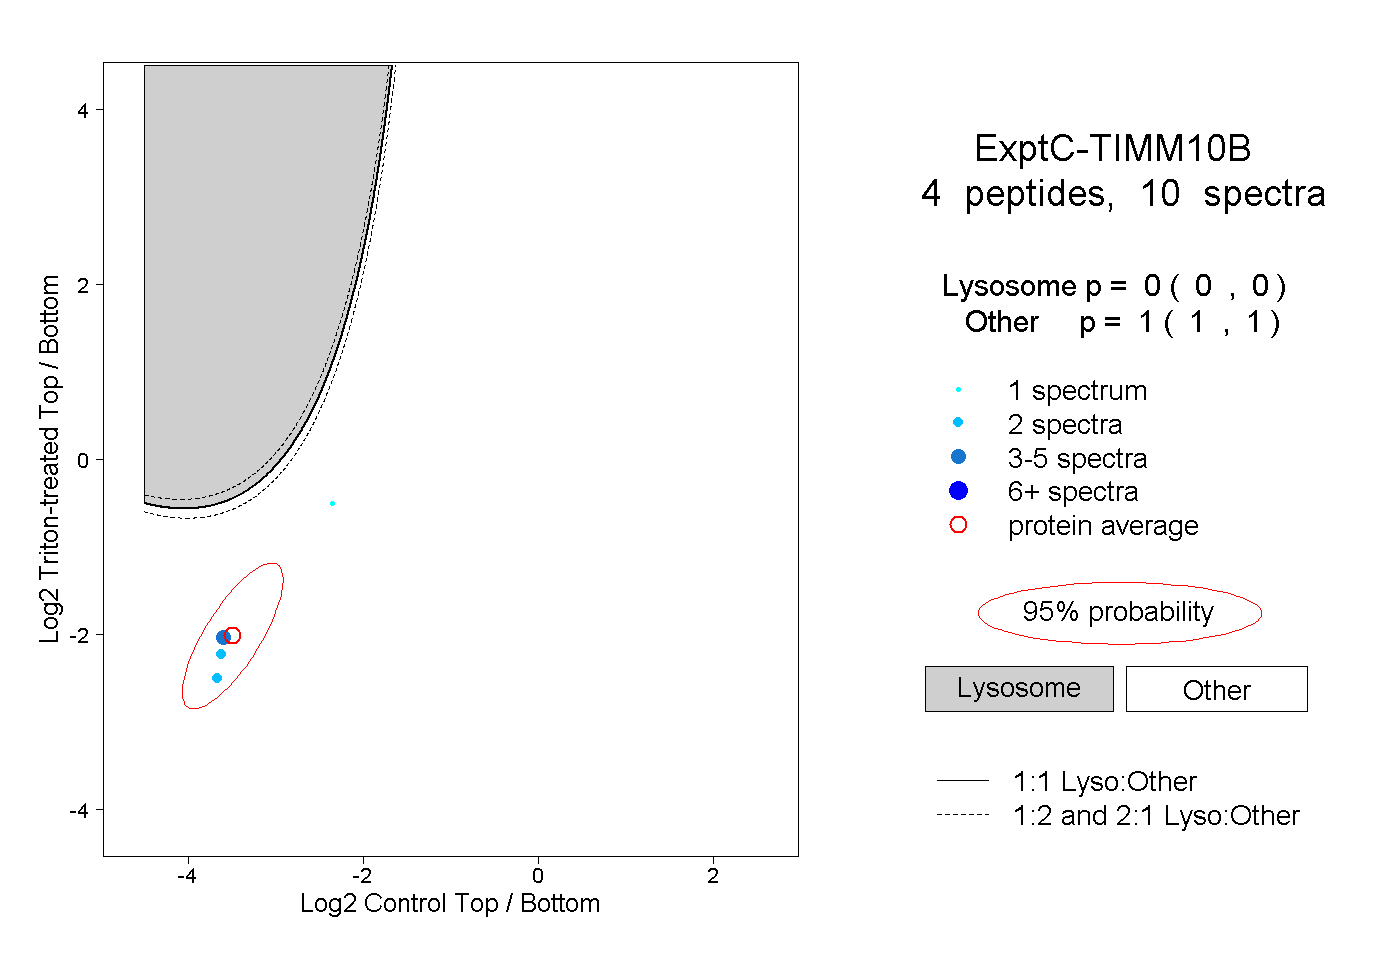 |
0.000 0.000 | 0.000 |
1.000 1.000 | 1.000 |