 6
6peptides
spectra
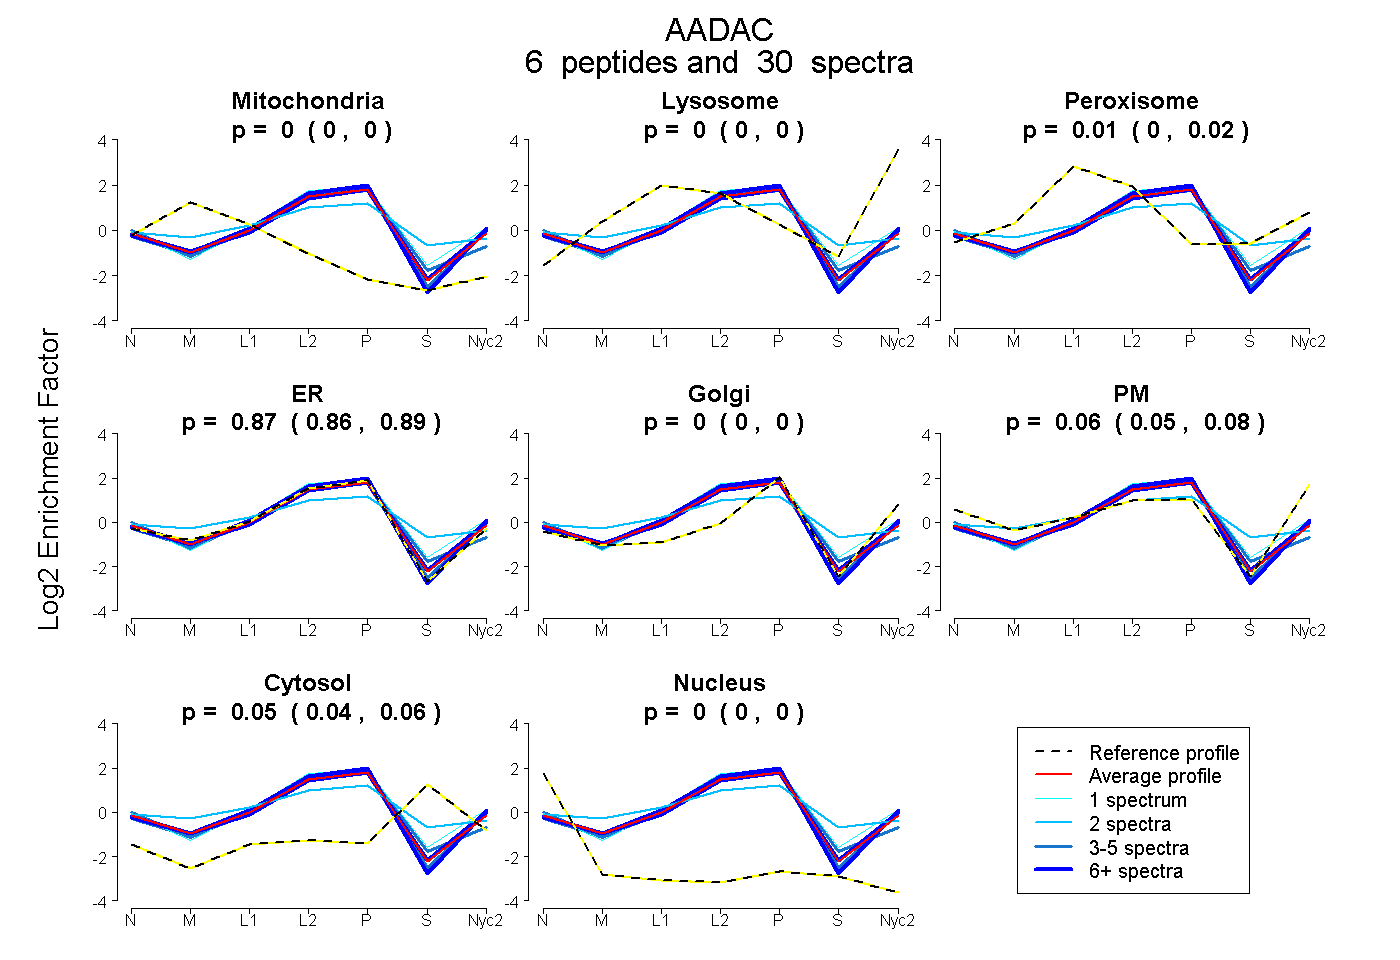
0.000 | 0.000
0.000 | 0.000
0.001 | 0.018
0.856 | 0.888
0.000 | 0.000
0.045 | 0.078
0.043 | 0.060
0.000 | 0.000
4peptides
spectra
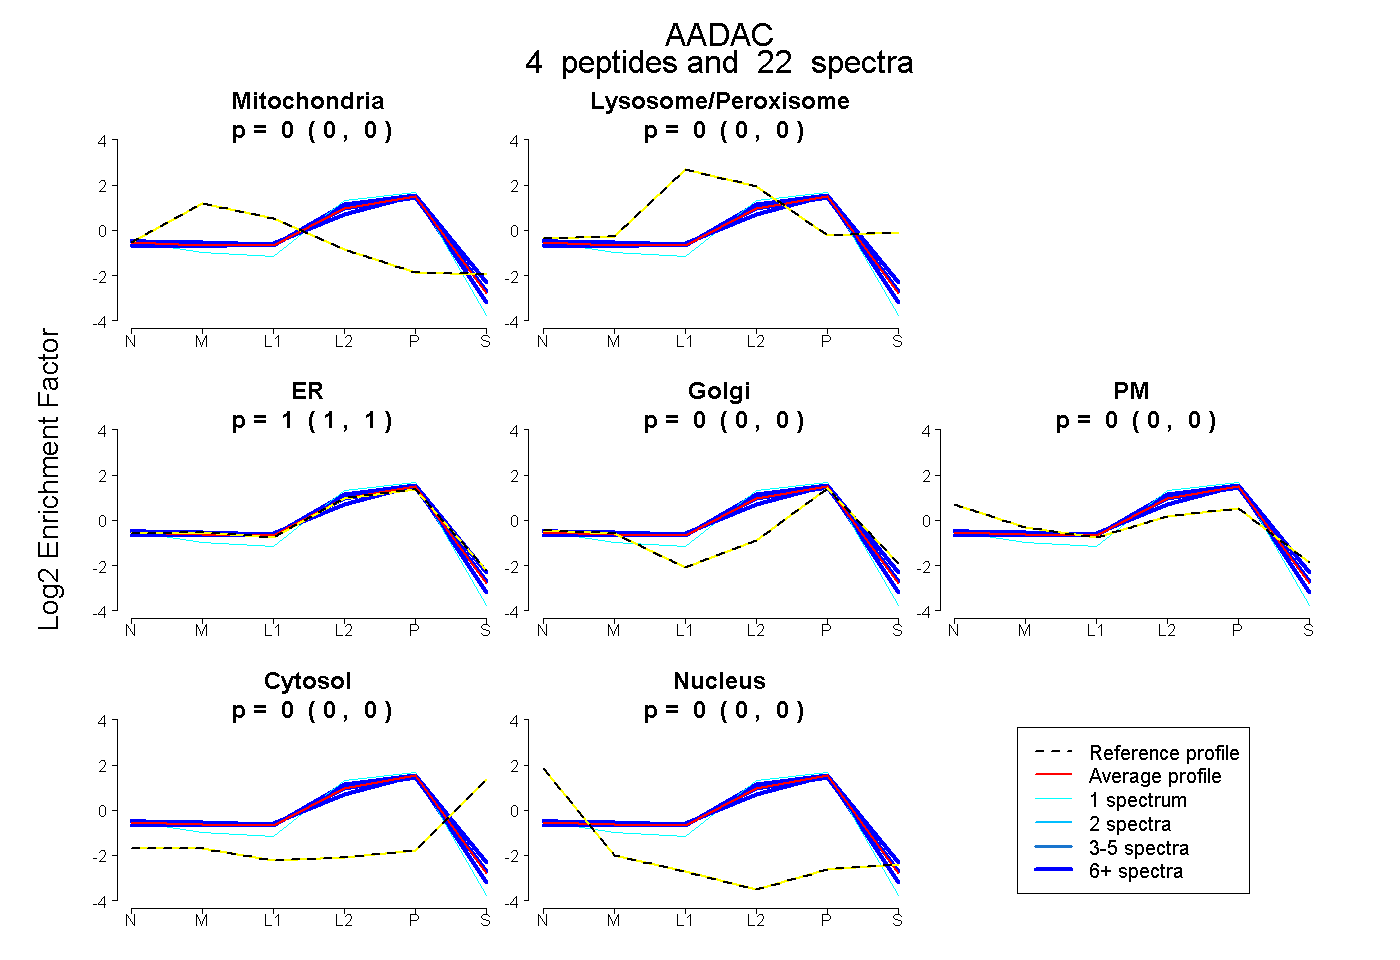
0.000 | 0.000
0.000 | 0.000
1.000 | 1.000
0.000 | 0.000
0.000 | 0.000
0.000 | 0.000
0.000 | 0.000
5peptides
spectra
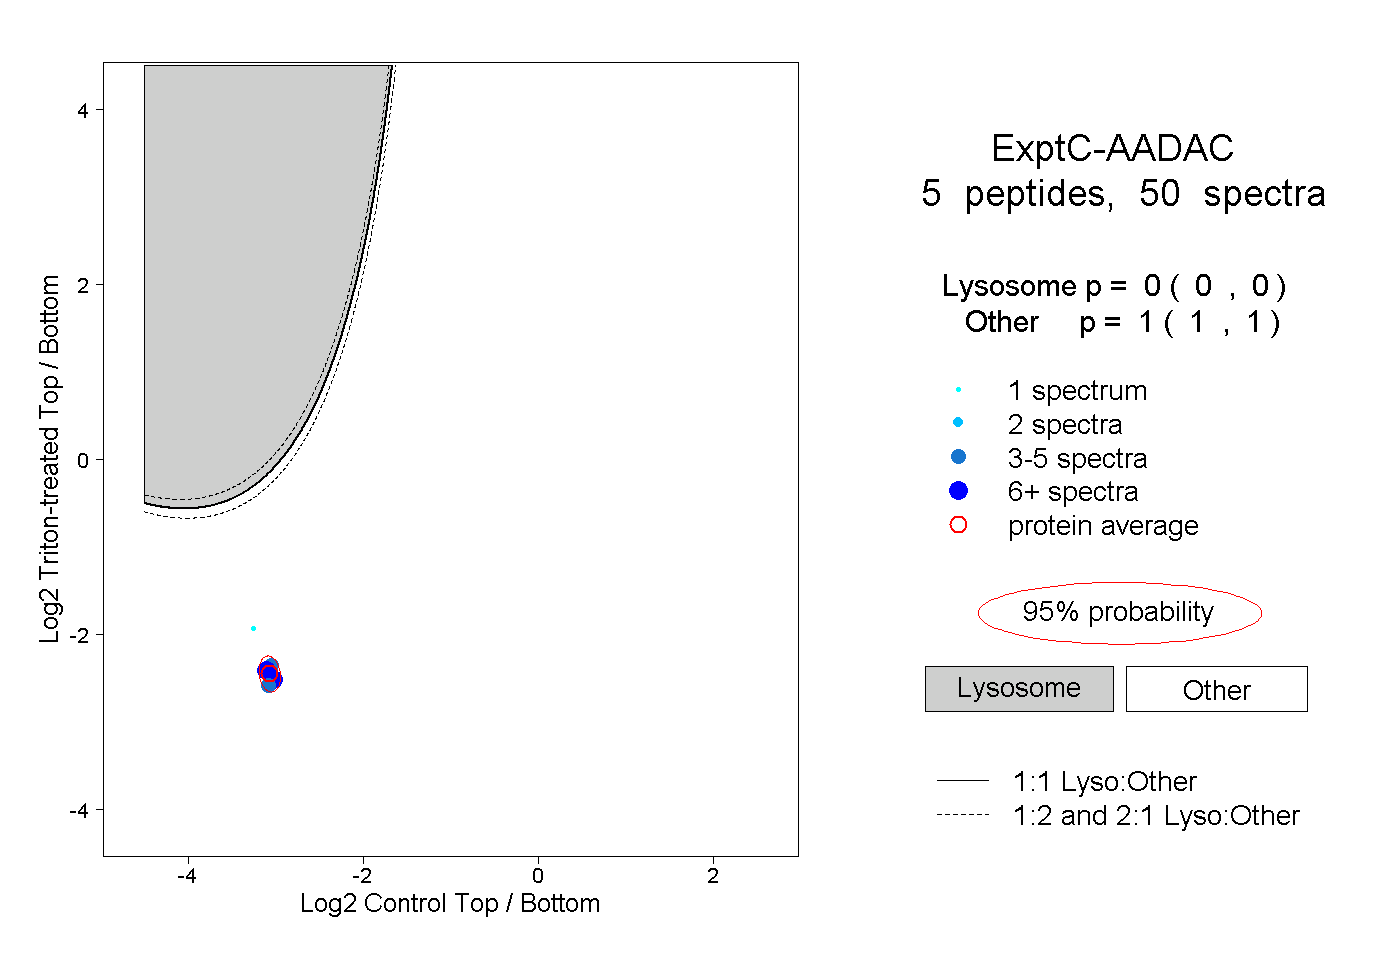
0.000 | 0.000
1.000 | 1.000
3peptides
spectra
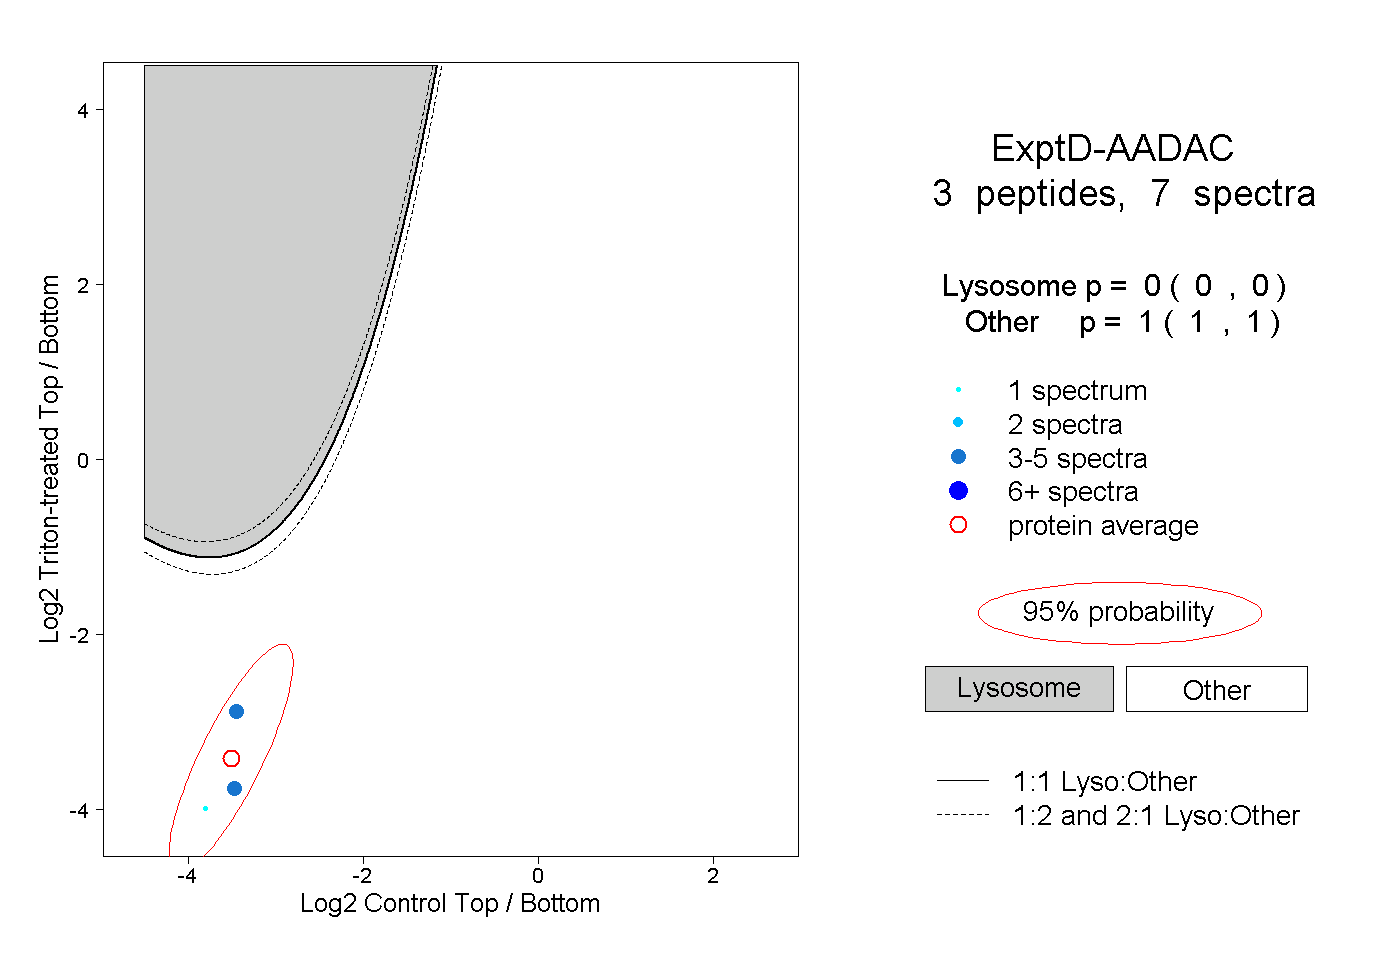
0.000 | 0.000
1.000 | 1.000