 6
6peptides
spectra
0.000 | 0.000
0.000 | 0.000
0.001 | 0.018
0.856 | 0.888
0.000 | 0.000
0.045 | 0.078
0.043 | 0.060
0.000 | 0.000
| Plot | Mito | Lyso | Perox | ER | Golgi | PM | Cytosol | Nucleus | |||||
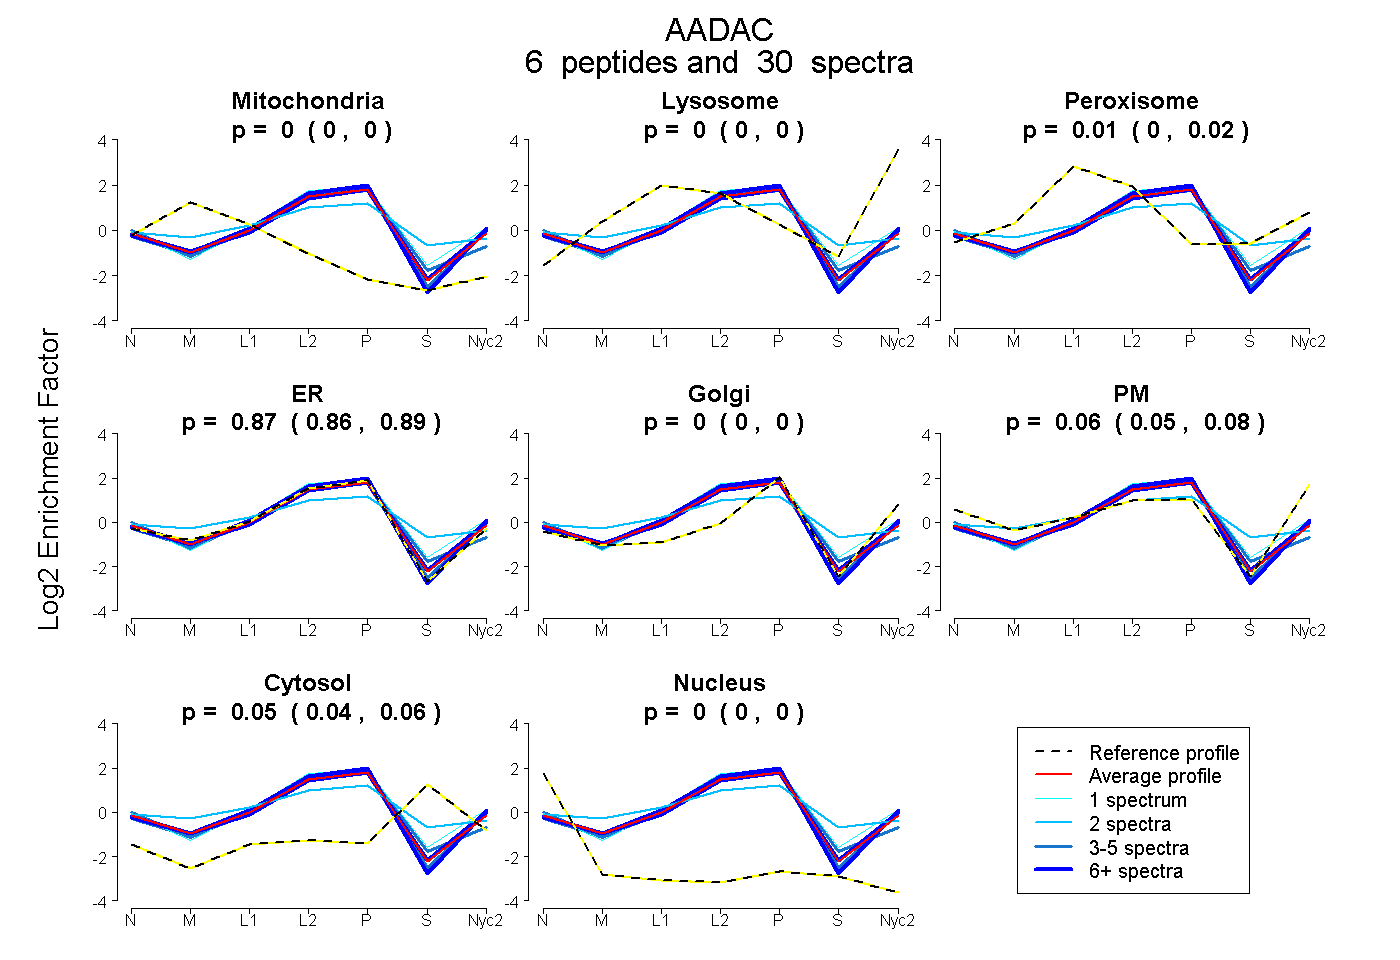
| Expt A |
6 peptides |
30 spectra |
|
0.000 0.000 | 0.000 |
0.000 0.000 | 0.000 |
0.010 0.001 | 0.018 |
0.874 0.856 | 0.888 |
0.000 0.000 | 0.000 |
0.064 0.045 | 0.078 |
0.053 0.043 | 0.060 |
0.000 0.000 | 0.000 |
| 2 spectra, YGVDPR | 0.000 | 0.000 | 0.230 | 0.560 | 0.011 | 0.000 | 0.199 | 0.000 | ||
| 5 spectra, IILGNTLLK | 0.000 | 0.000 | 0.000 | 0.863 | 0.000 | 0.107 | 0.023 | 0.007 | ||
| 8 spectra, WFLQEDILEK | 0.000 | 0.000 | 0.000 | 0.906 | 0.004 | 0.090 | 0.000 | 0.000 | ||
| 10 spectra, QFEDVYHSLR | 0.000 | 0.000 | 0.000 | 0.822 | 0.023 | 0.099 | 0.057 | 0.000 | ||
| 1 spectrum, LDAVVVSTDYGLAPK | 0.000 | 0.033 | 0.046 | 0.803 | 0.000 | 0.038 | 0.079 | 0.000 | ||
| 4 spectra, IYIPK | 0.000 | 0.000 | 0.001 | 0.893 | 0.000 | 0.000 | 0.106 | 0.000 |
| Plot | Mito | Lyso or Perox | ER | Golgi | PM | Cytosol | Nucleus | ||||||
| Expt B |
4 peptides |
22 spectra |
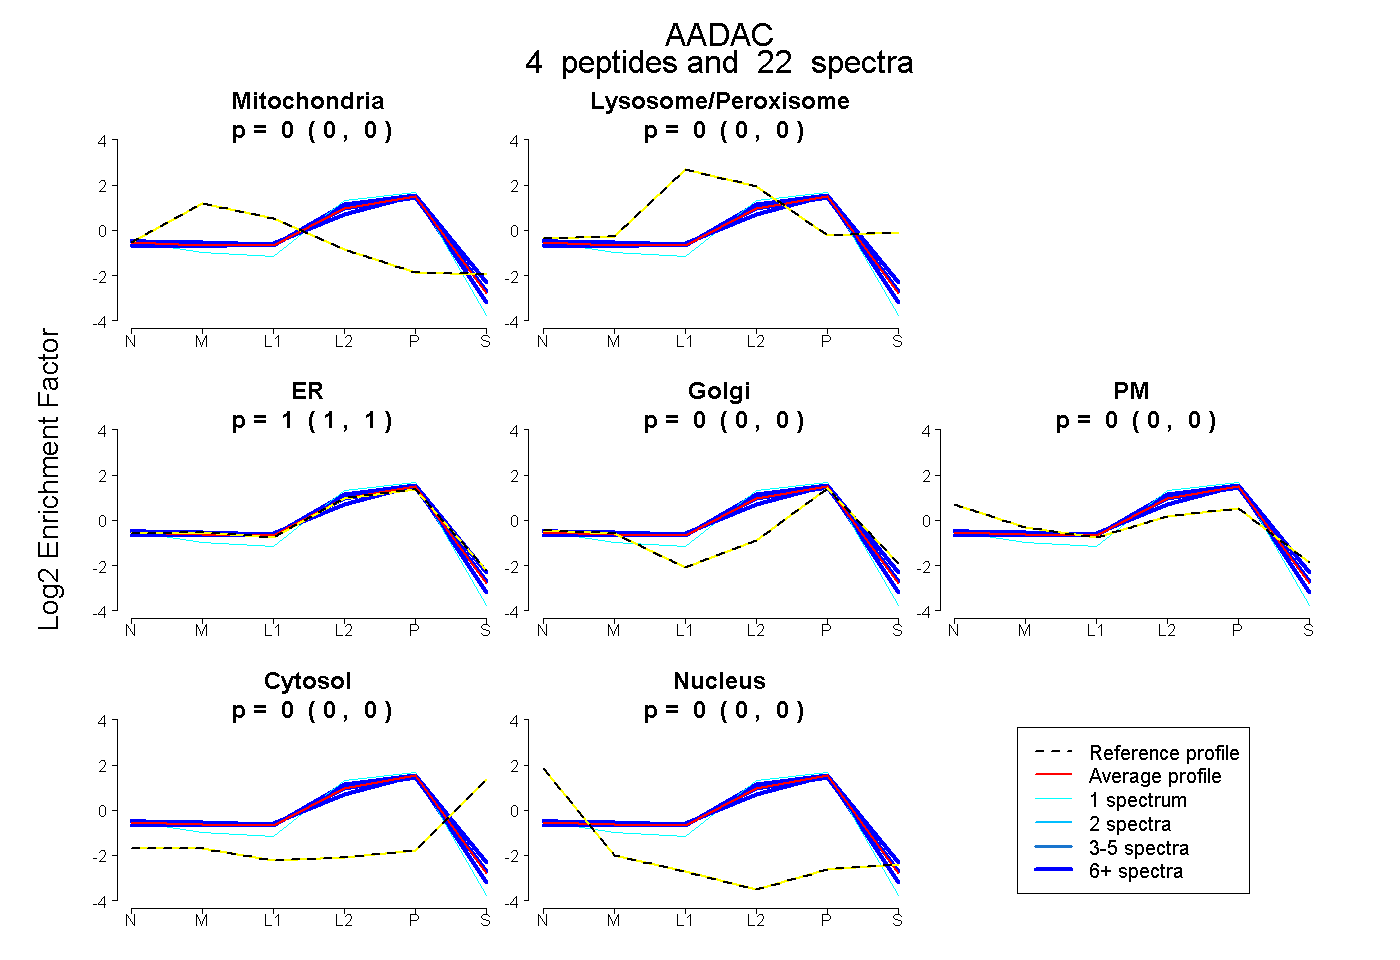 |
0.000 0.000 | 0.000 |
0.000 0.000 | 0.000 |
1.000 1.000 | 1.000 |
0.000 0.000 | 0.000 |
0.000 0.000 | 0.000 |
0.000 0.000 | 0.000 |
0.000 0.000 | 0.000 |
|||
| Plot | Lyso | Other | |||||||||||
| Expt C |
5 peptides |
50 spectra |
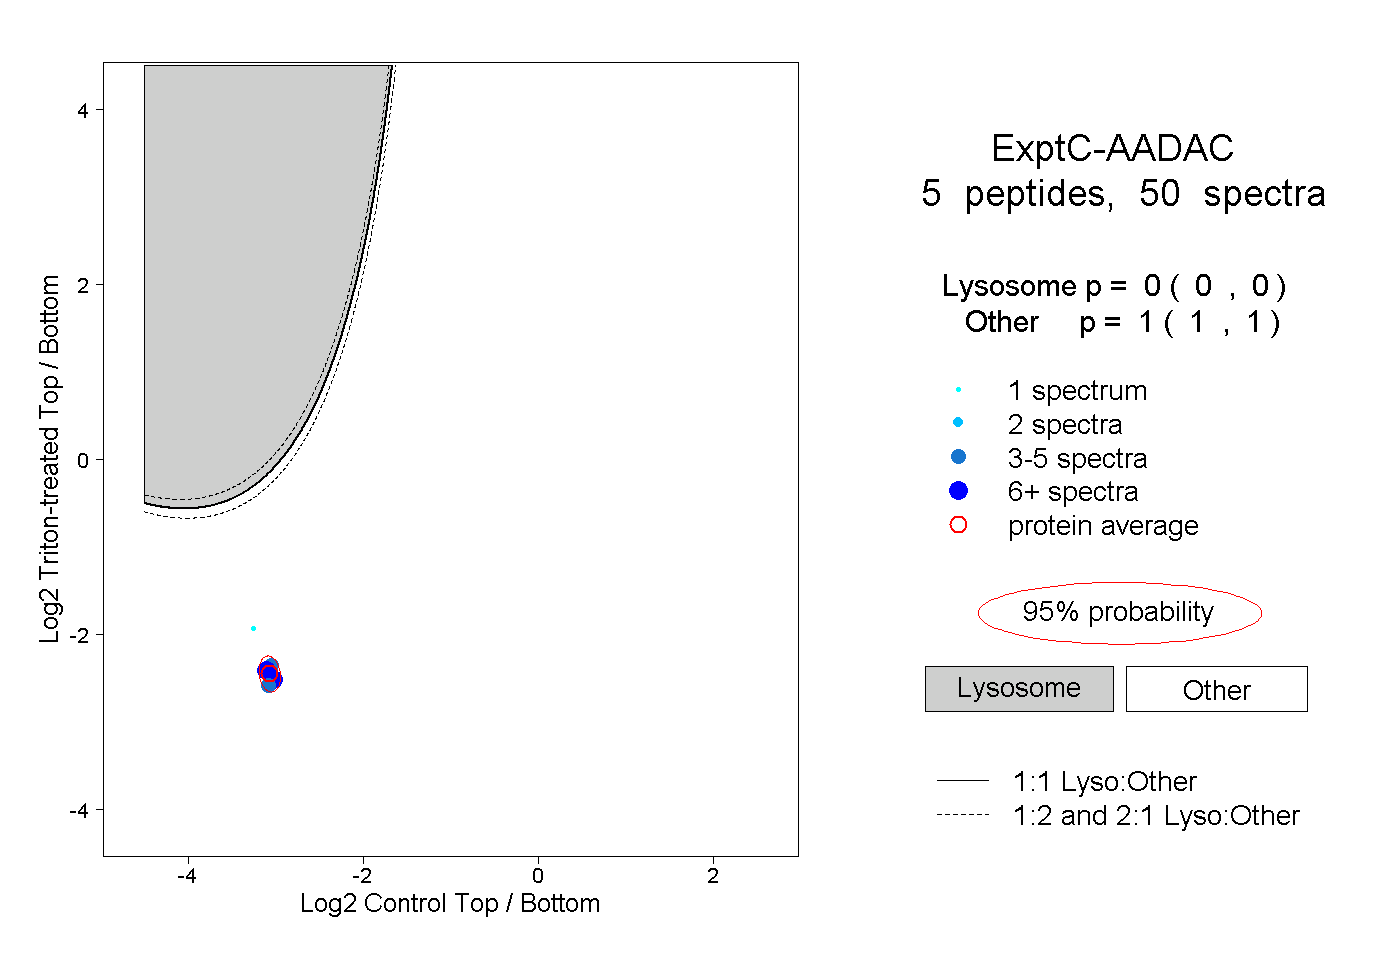 |
0.000 0.000 | 0.000 |
1.000 1.000 | 1.000 |
||||||||
| Plot | Lyso | Other | |||||||||||
| Expt D |
3 peptides |
7 spectra |
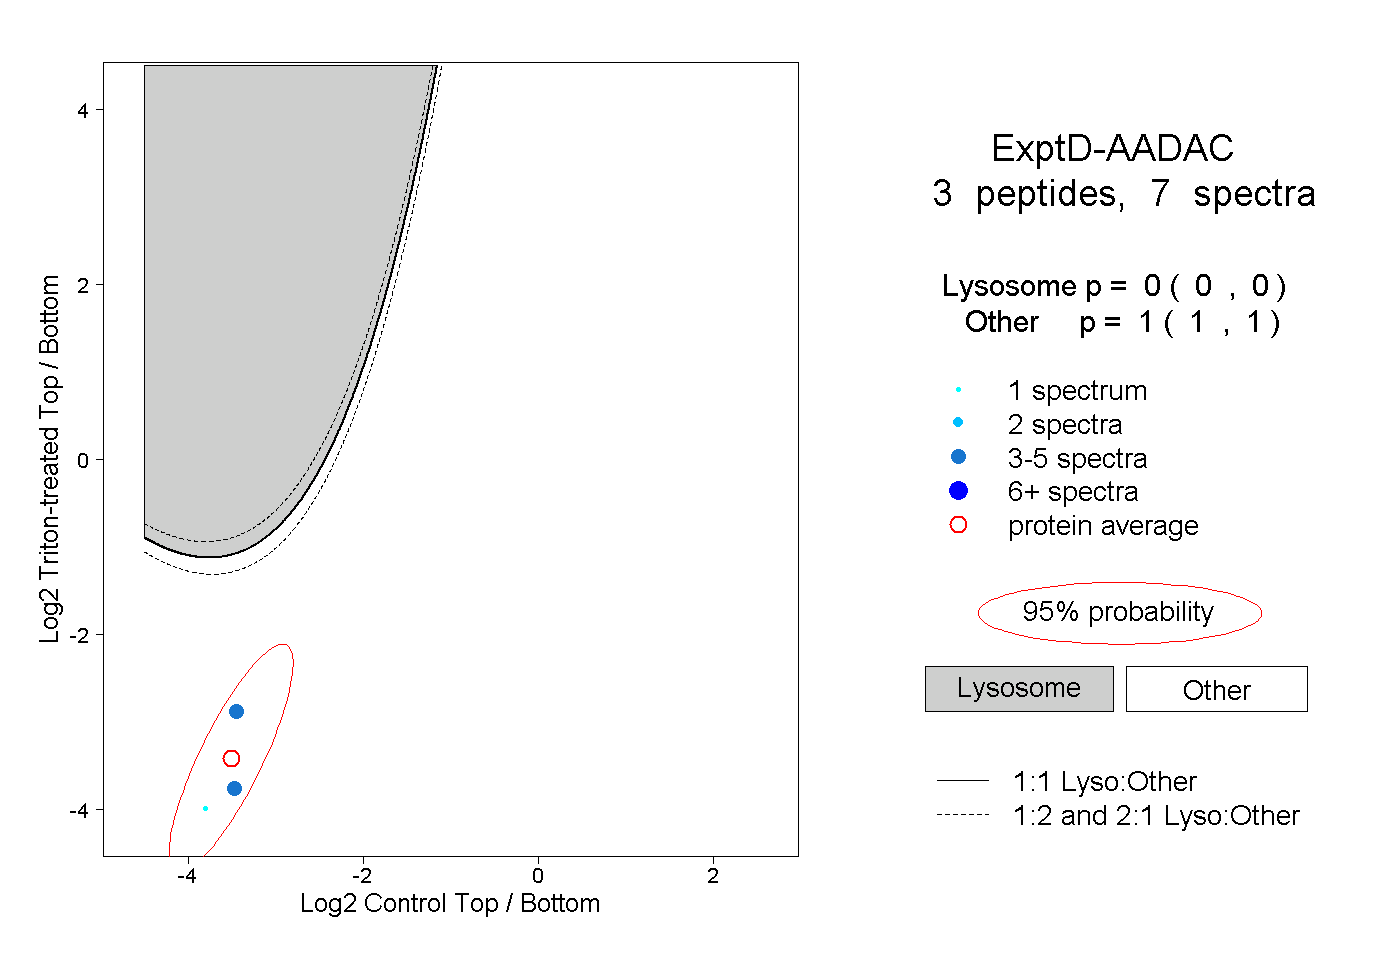 |
0.000 0.000 | 0.000 |
1.000 1.000 | 1.000 |