 6
6peptides
spectra
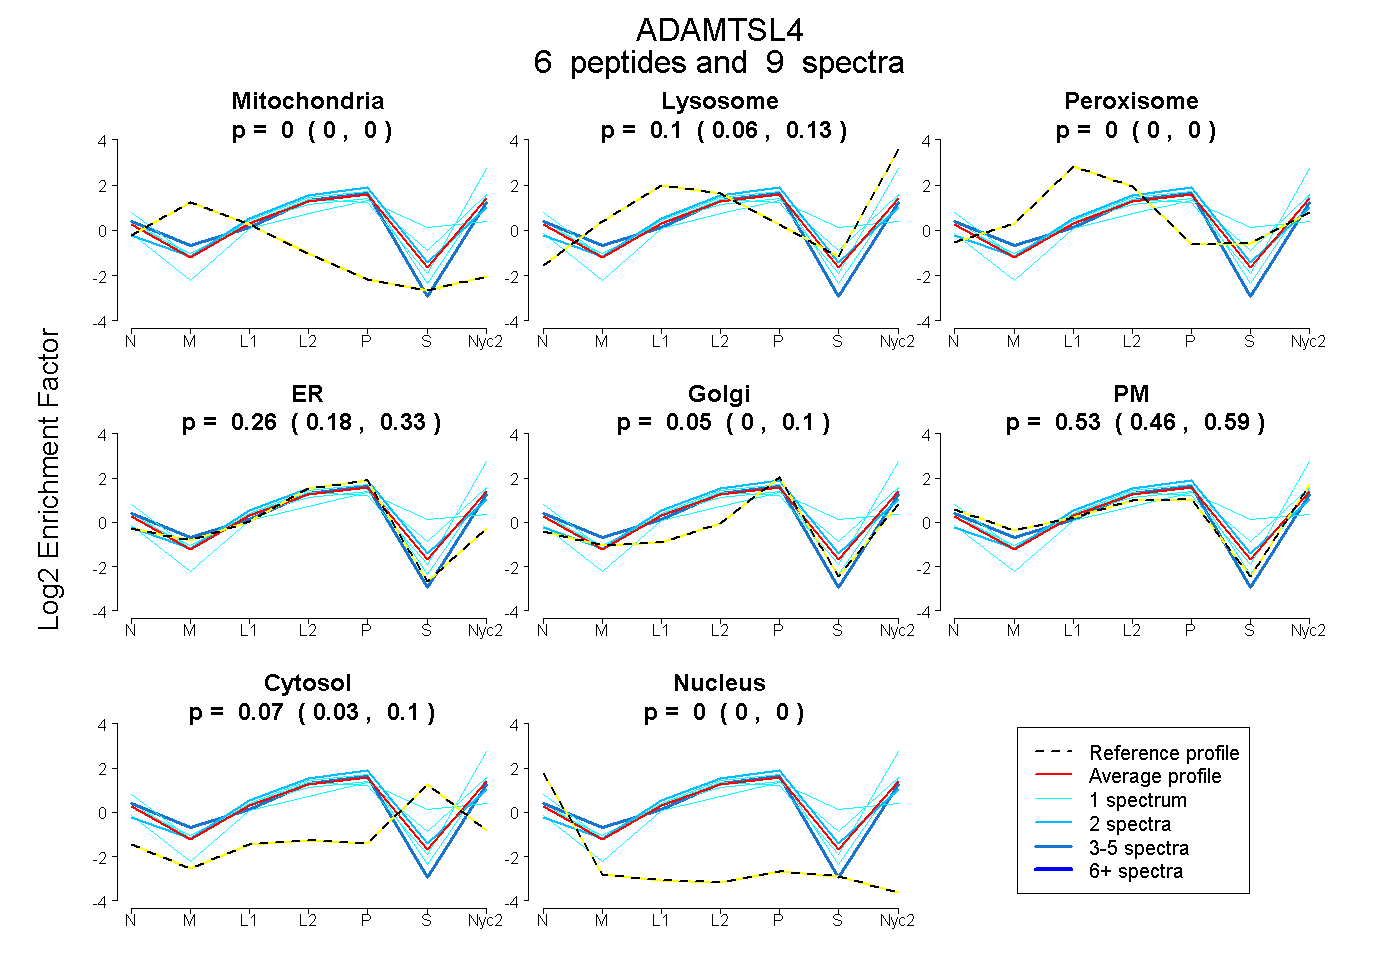
0.000 | 0.000
0.056 | 0.129
0.000 | 0.000
0.178 | 0.326
0.000 | 0.103
0.461 | 0.594
0.029 | 0.095
0.000 | 0.000
3peptides
spectra

0.000 | 0.000
1.000 | 1.000
1peptide
spectrum
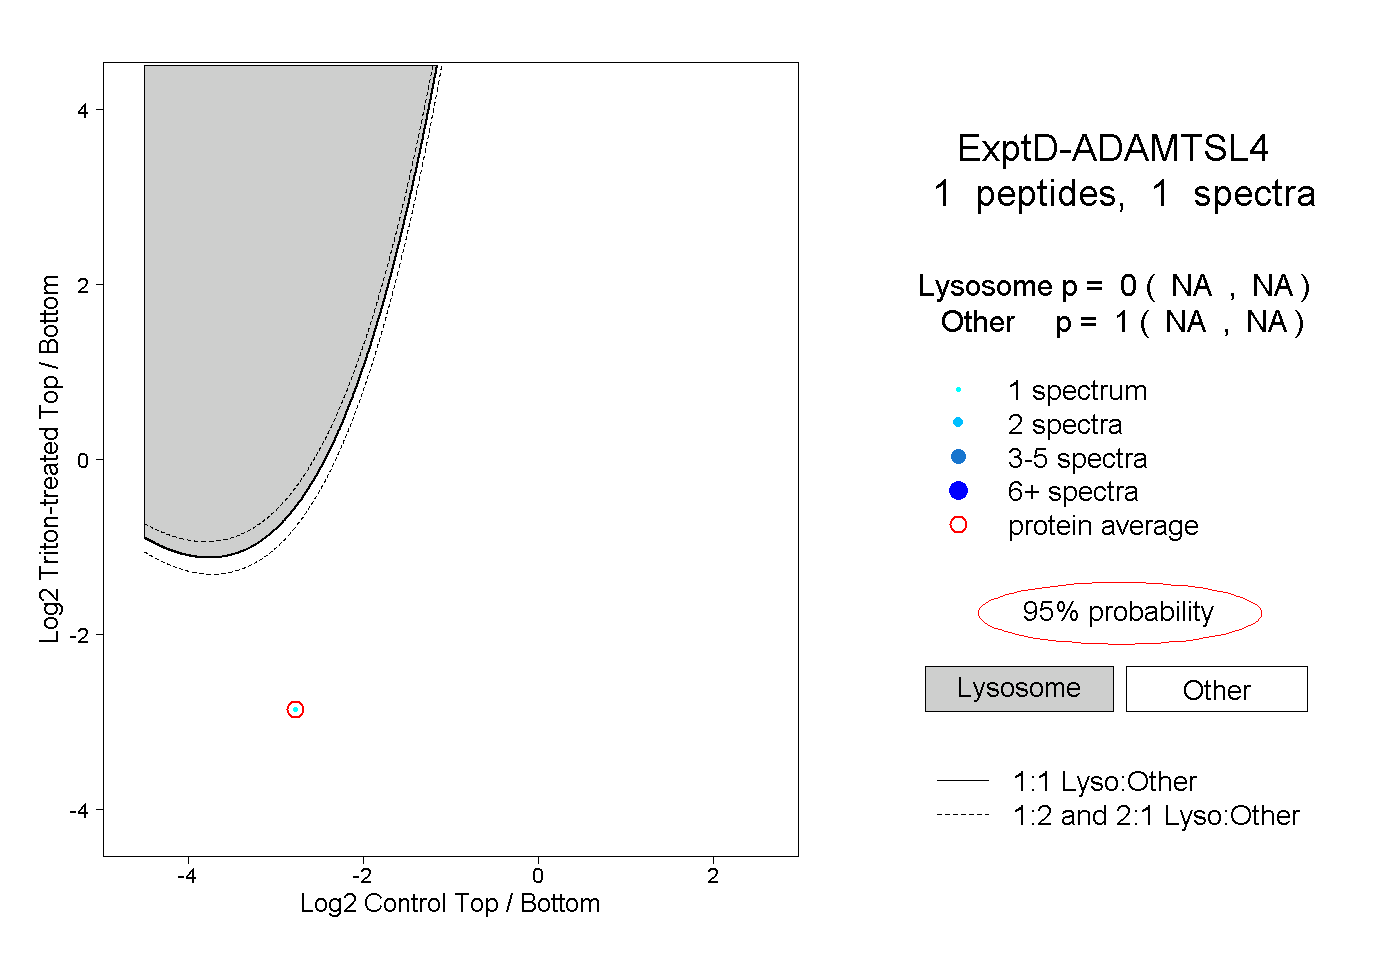
NA | NA
NA | NA