 6
6peptides
spectra
0.000 | 0.000
0.056 | 0.129
0.000 | 0.000
0.178 | 0.326
0.000 | 0.103
0.461 | 0.594
0.029 | 0.095
0.000 | 0.000
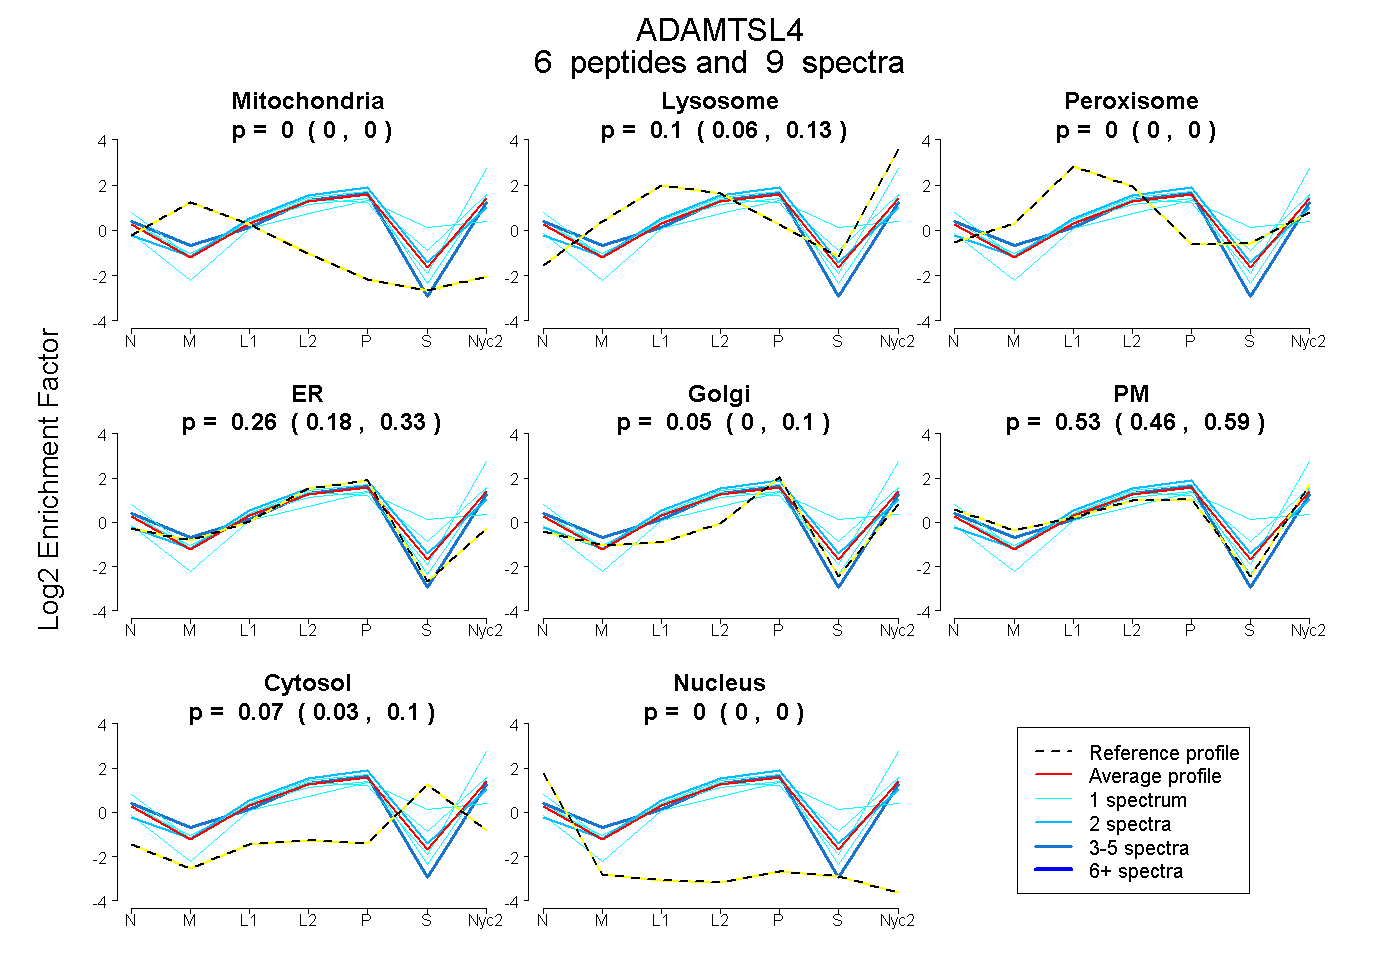
| Plot | Mito | Lyso | Perox | ER | Golgi | PM | Cytosol | Nucleus | |||||
| Expt A |
6 peptides |
9 spectra |
|
0.000 0.000 | 0.000 |
0.096 0.056 | 0.129 |
0.000 0.000 | 0.000 |
0.259 0.178 | 0.326 |
0.046 0.000 | 0.103 |
0.533 0.461 | 0.594 |
0.065 0.029 | 0.095 |
0.000 0.000 | 0.000 |
| 3 spectra, GQGSRPQTPR | 0.000 | 0.000 | 0.000 | 0.330 | 0.000 | 0.670 | 0.000 | 0.000 | ||
| 2 spectra, VPFALPLHR | 0.000 | 0.232 | 0.000 | 0.582 | 0.056 | 0.078 | 0.052 | 0.000 | ||
| 1 spectrum, ISQFRPSSNYLALR | 0.000 | 0.133 | 0.000 | 0.000 | 0.000 | 0.867 | 0.000 | 0.000 | ||
| 1 spectrum, APGTLQR | 0.000 | 0.037 | 0.000 | 0.294 | 0.000 | 0.669 | 0.000 | 0.000 | ||
| 1 spectrum, RPDGCGVCGGDGSTCR | 0.000 | 0.090 | 0.020 | 0.401 | 0.000 | 0.097 | 0.392 | 0.000 | ||
| 1 spectrum, MPTSQGAER | 0.000 | 0.164 | 0.000 | 0.131 | 0.000 | 0.557 | 0.148 | 0.000 |
| Plot | Lyso | Other | |||||||||||
| Expt C |
3 peptides |
4 spectra |
 |
0.000 0.000 | 0.000 |
1.000 1.000 | 1.000 |
||||||||
| Plot | Lyso | Other | |||||||||||
| Expt D |
1 peptide |
1 spectrum |
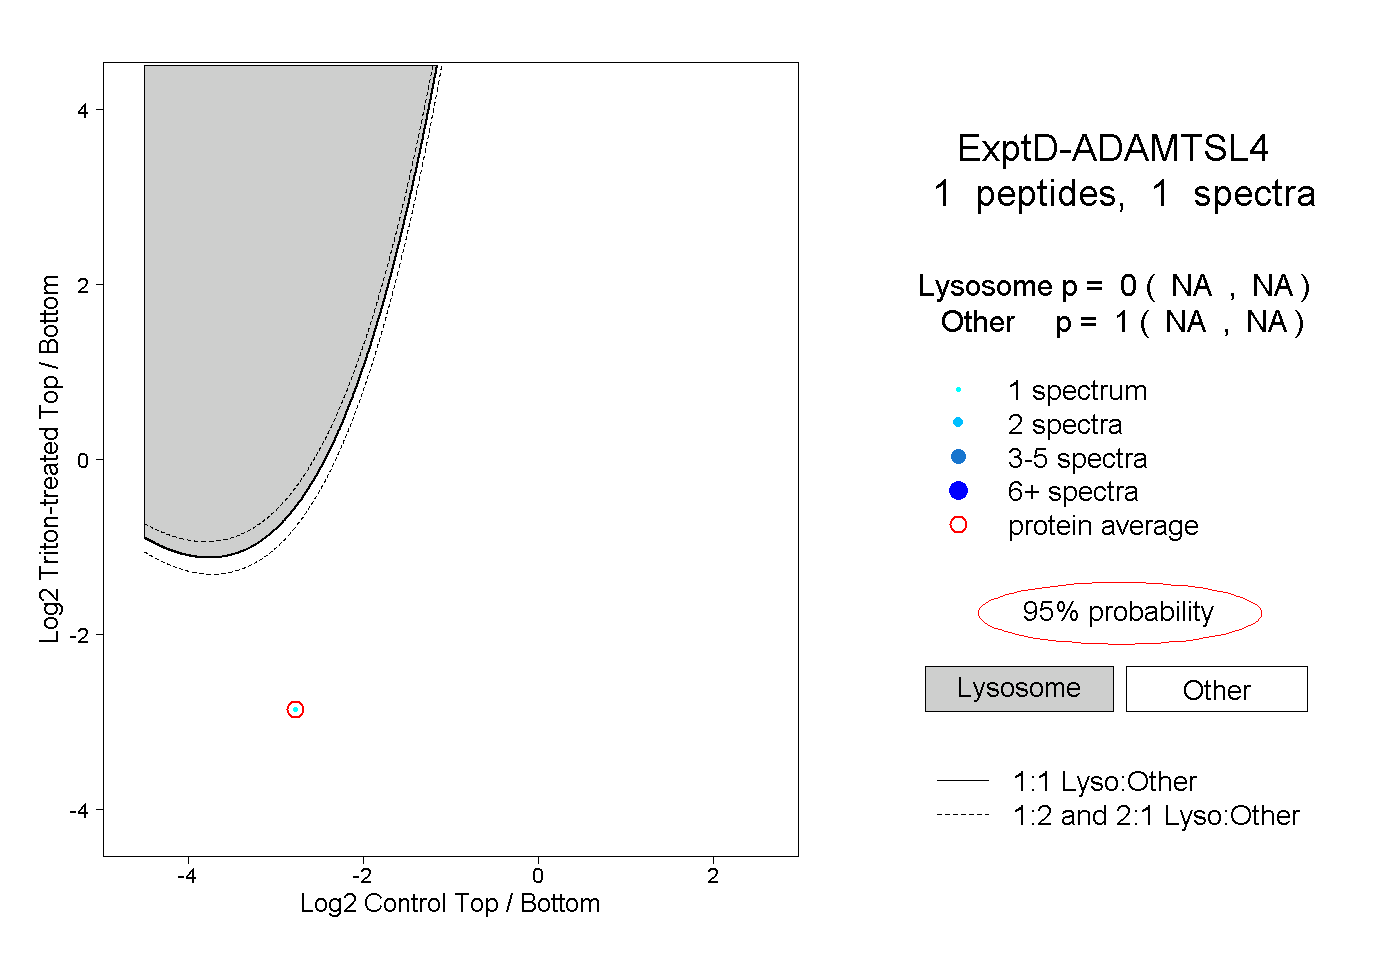 |
0.000 NA | NA |
1.000 NA | NA |