 7
7peptides
spectra
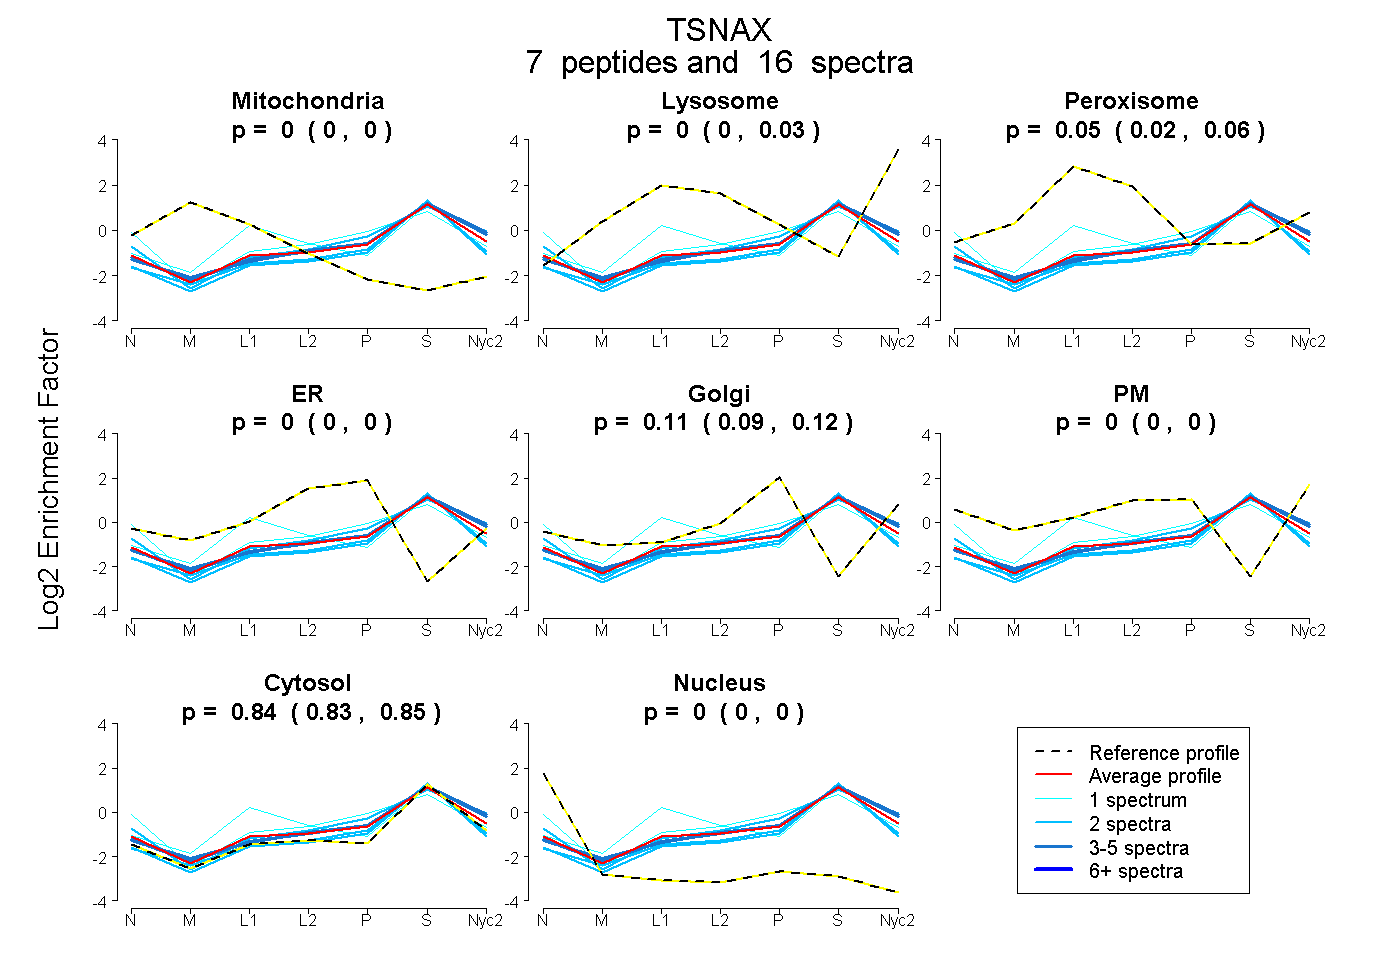
0.000 | 0.000
0.000 | 0.027
0.017 | 0.061
0.000 | 0.000
0.087 | 0.118
0.000 | 0.002
0.831 | 0.852
0.000 | 0.000
2peptides
spectra
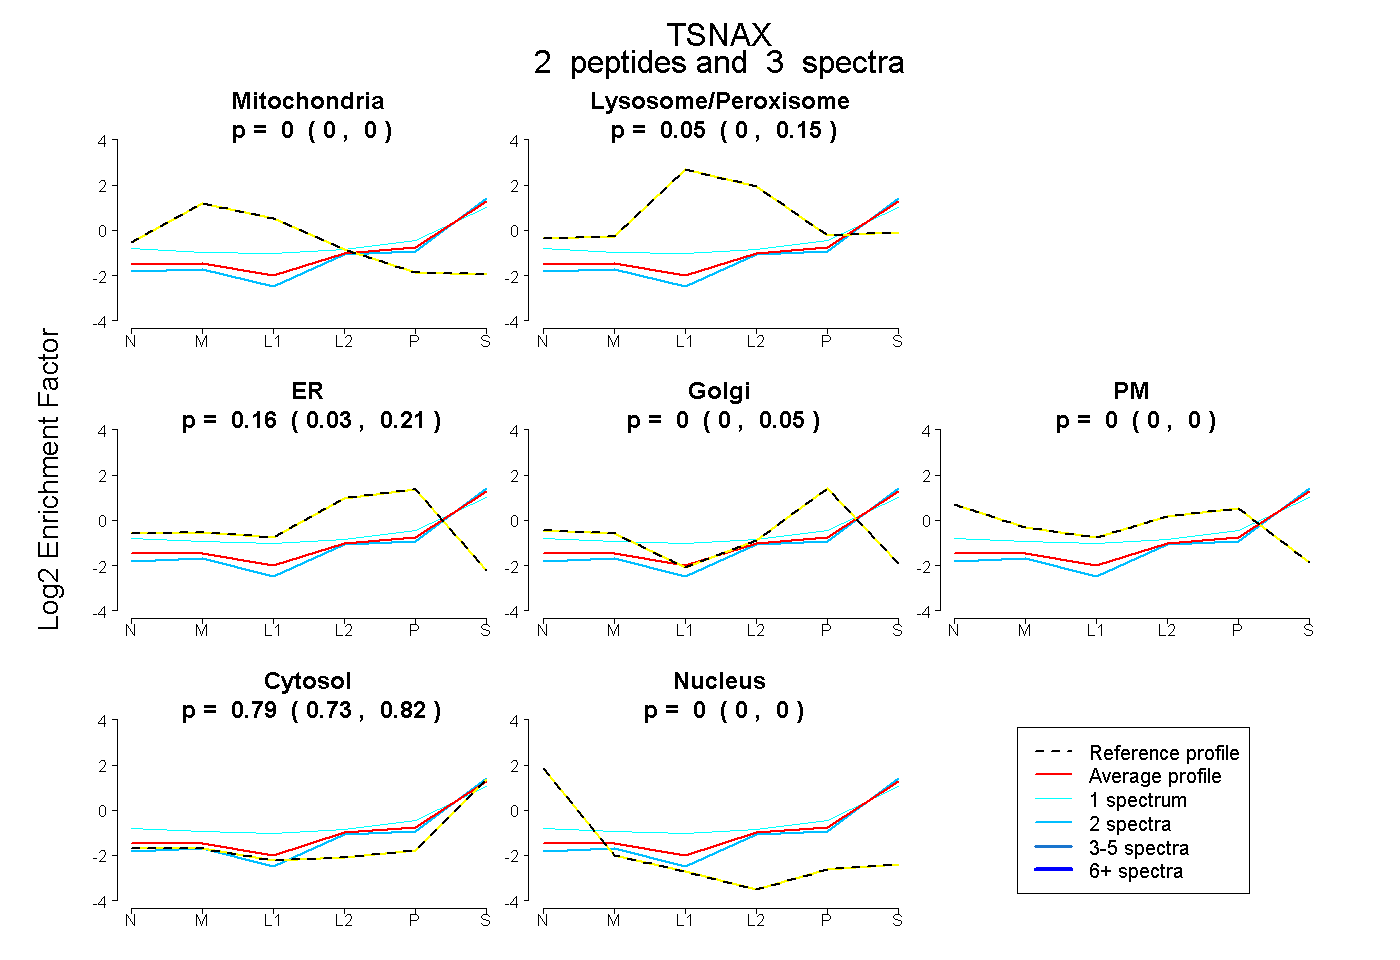
0.000 | 0.000
0.000 | 0.146
0.033 | 0.205
0.000 | 0.053
0.000 | 0.000
0.732 | 0.821
0.000 | 0.000
4peptides
spectra
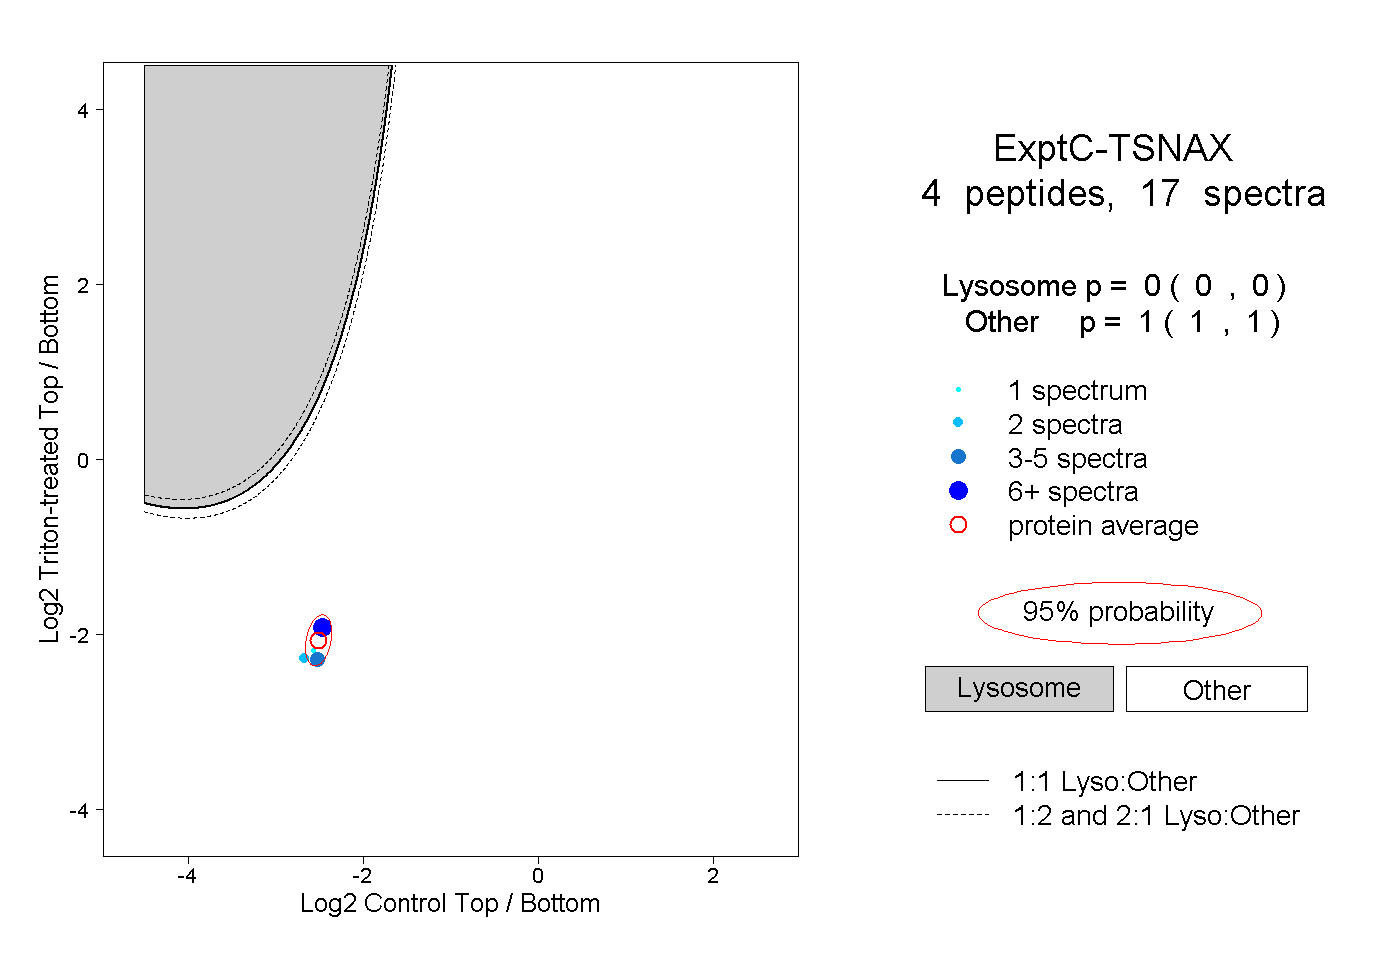
0.000 | 0.000
1.000 | 1.000
1peptide
spectra
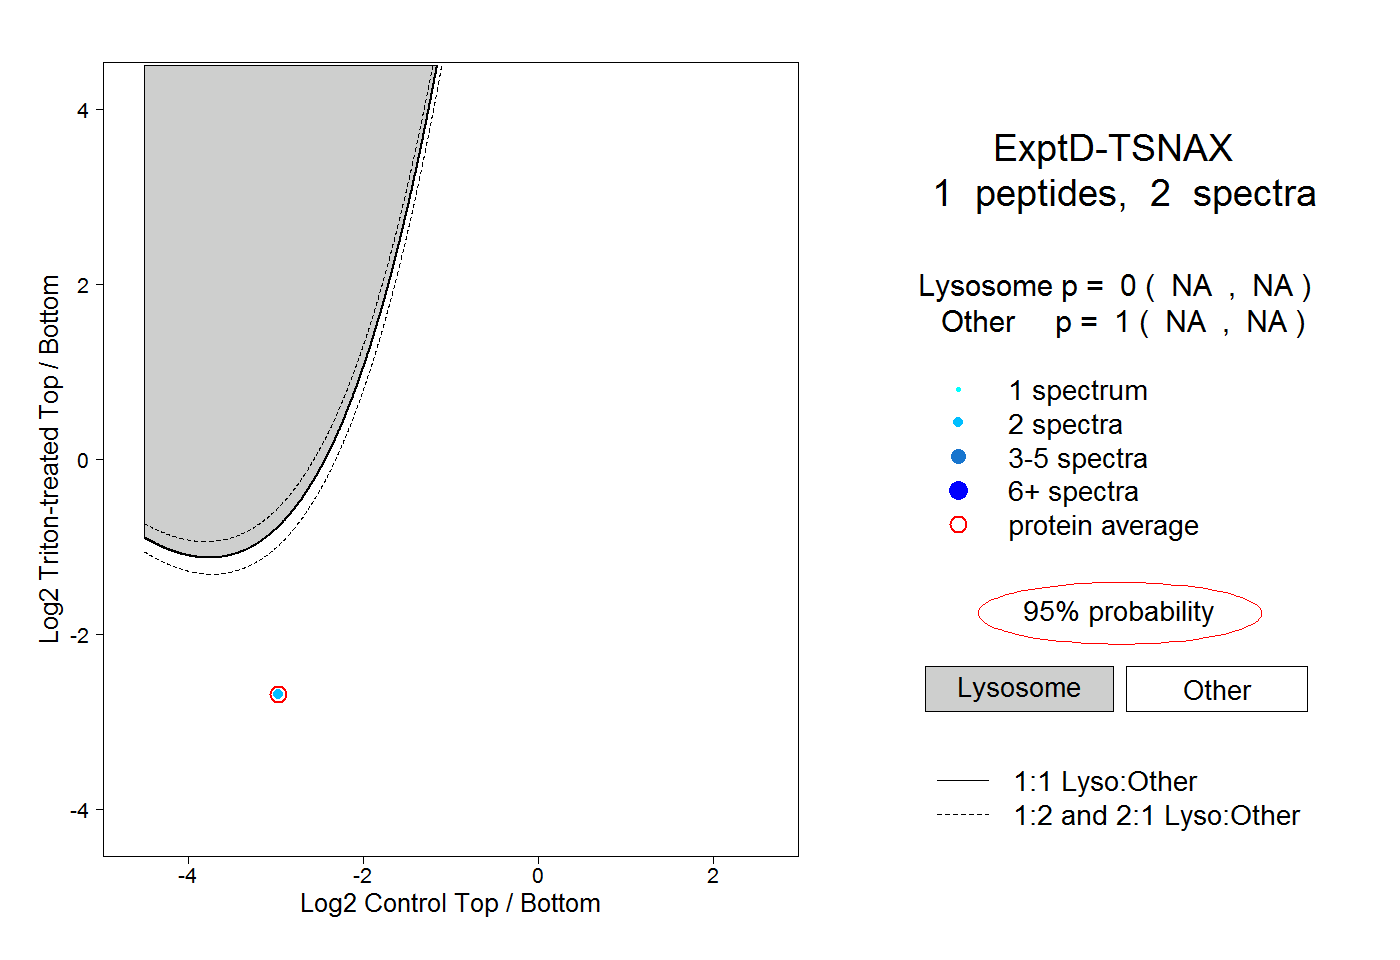
NA | NA
NA | NA