 7
7peptides
spectra
0.000 | 0.000
0.000 | 0.027
0.017 | 0.061
0.000 | 0.000
0.087 | 0.118
0.000 | 0.002
0.831 | 0.852
0.000 | 0.000
| Plot | Mito | Lyso | Perox | ER | Golgi | PM | Cytosol | Nucleus | |||||
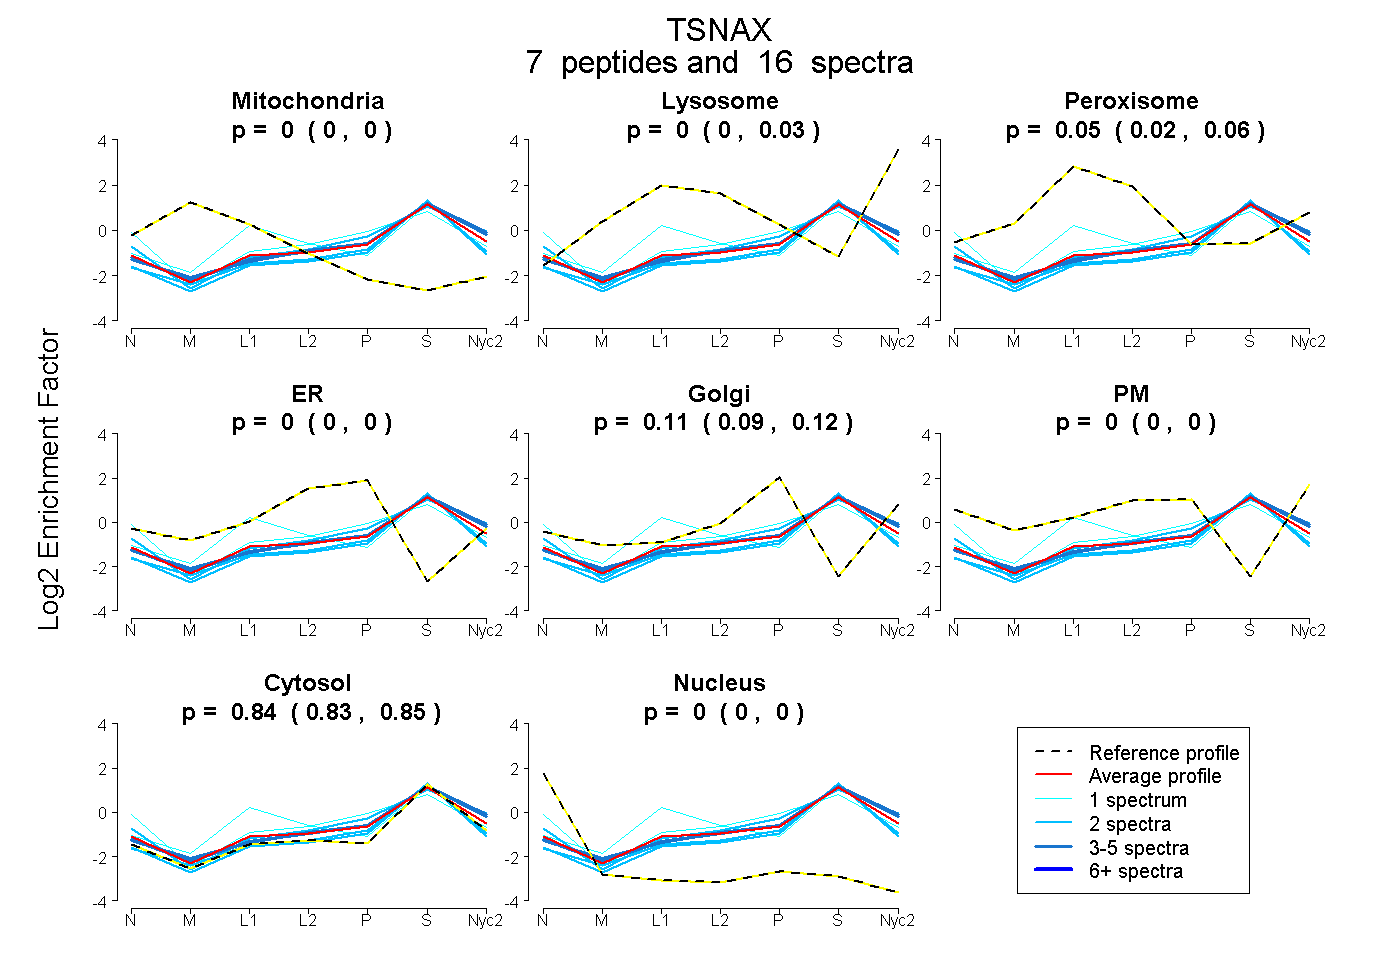
| Expt A |
7 peptides |
16 spectra |
|
0.000 0.000 | 0.000 |
0.004 0.000 | 0.027 |
0.046 0.017 | 0.061 |
0.000 0.000 | 0.000 |
0.108 0.087 | 0.118 |
0.000 0.000 | 0.002 |
0.841 0.831 | 0.852 |
0.000 0.000 | 0.000 |
| 2 spectra, EGPGGFR | 0.000 | 0.000 | 0.000 | 0.000 | 0.105 | 0.108 | 0.787 | 0.000 | ||
| 2 spectra, SLISMEEINR | 0.000 | 0.000 | 0.000 | 0.000 | 0.049 | 0.000 | 0.951 | 0.000 | ||
| 4 spectra, QLVTWR | 0.000 | 0.074 | 0.000 | 0.000 | 0.093 | 0.000 | 0.832 | 0.000 | ||
| 1 spectrum, APPADGQDK | 0.000 | 0.000 | 0.000 | 0.176 | 0.000 | 0.083 | 0.731 | 0.010 | ||
| 4 spectra, TIFLLHR | 0.000 | 0.071 | 0.000 | 0.000 | 0.097 | 0.000 | 0.831 | 0.000 | ||
| 2 spectra, SFQQELDTR | 0.000 | 0.000 | 0.000 | 0.000 | 0.010 | 0.000 | 0.990 | 0.000 | ||
| 1 spectrum, DITVESK | 0.000 | 0.000 | 0.281 | 0.000 | 0.000 | 0.000 | 0.719 | 0.000 |
| Plot | Mito | Lyso or Perox | ER | Golgi | PM | Cytosol | Nucleus | ||||||
| Expt B |
2 peptides |
3 spectra |
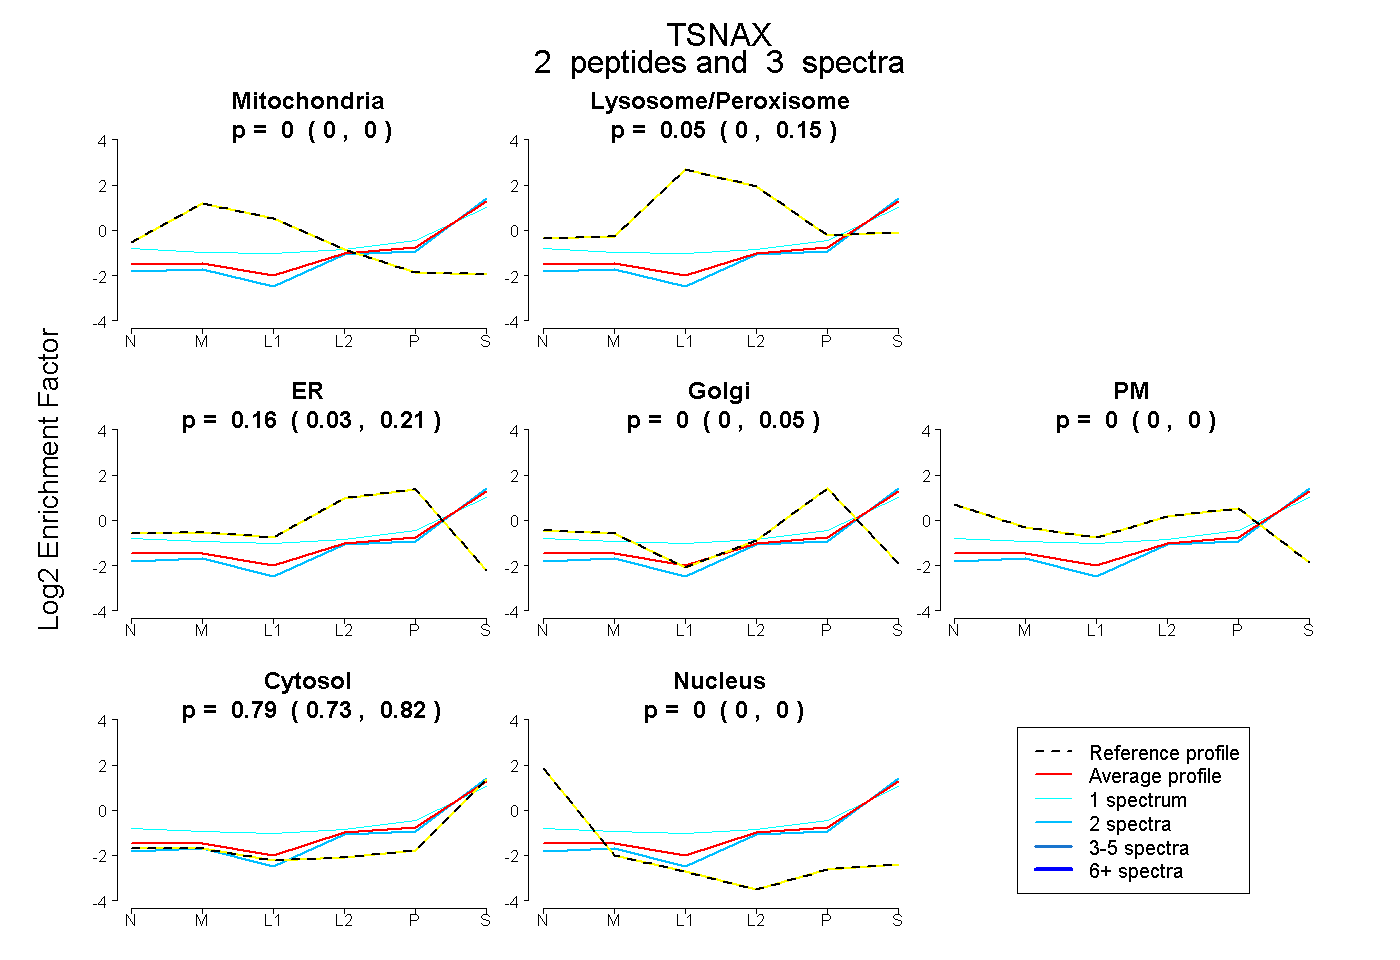 |
0.000 0.000 | 0.000 |
0.050 0.000 | 0.146 |
0.162 0.033 | 0.205 |
0.000 0.000 | 0.053 |
0.000 0.000 | 0.000 |
0.789 0.732 | 0.821 |
0.000 0.000 | 0.000 |
|||
| Plot | Lyso | Other | |||||||||||
| Expt C |
4 peptides |
17 spectra |
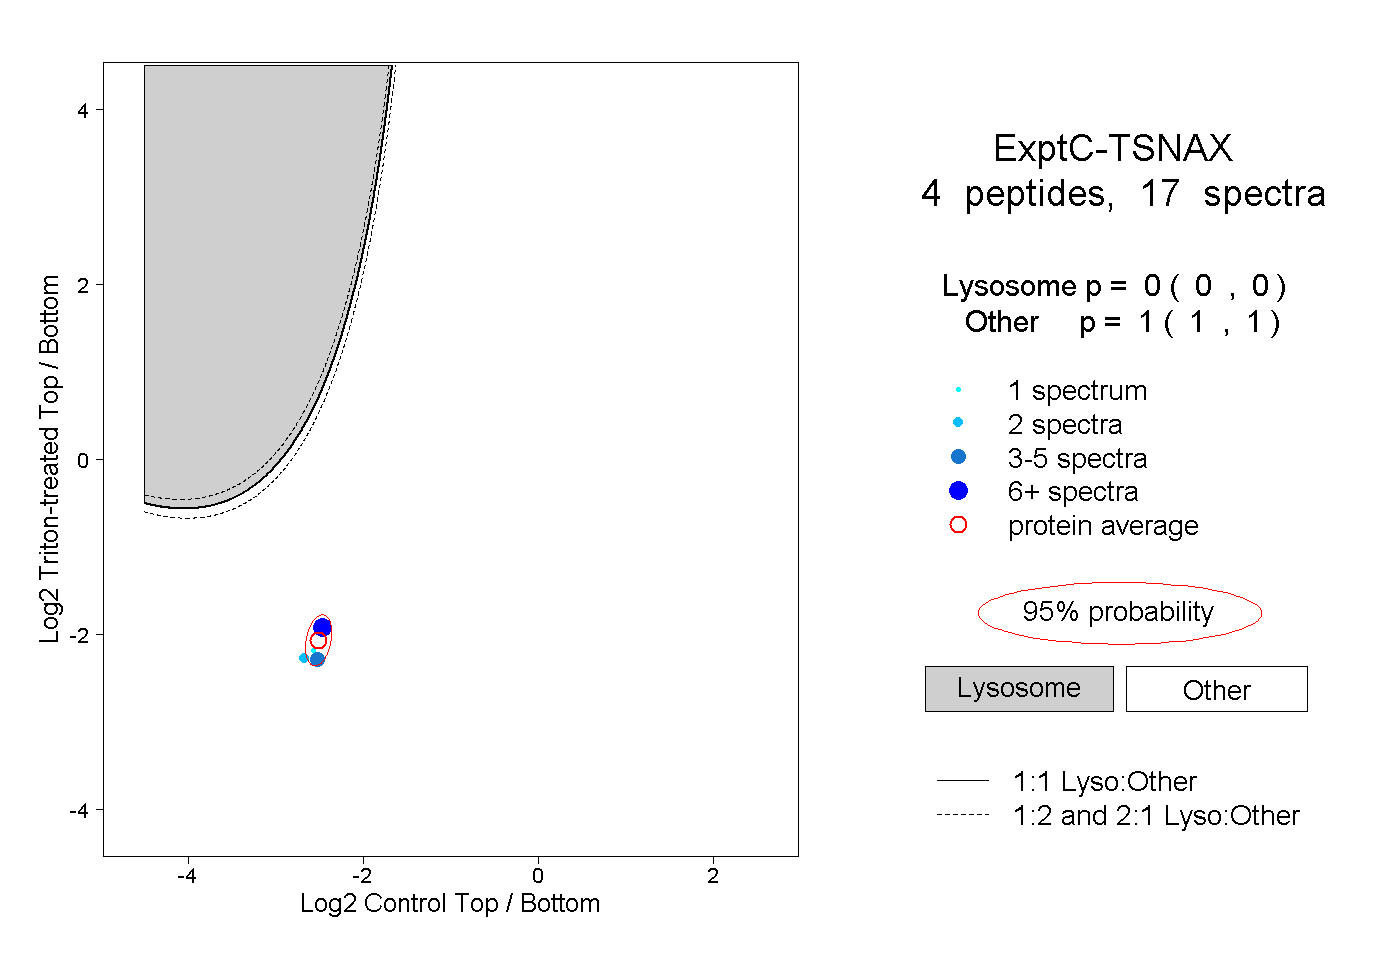 |
0.000 0.000 | 0.000 |
1.000 1.000 | 1.000 |
||||||||
| Plot | Lyso | Other | |||||||||||
| Expt D |
1 peptide |
2 spectra |
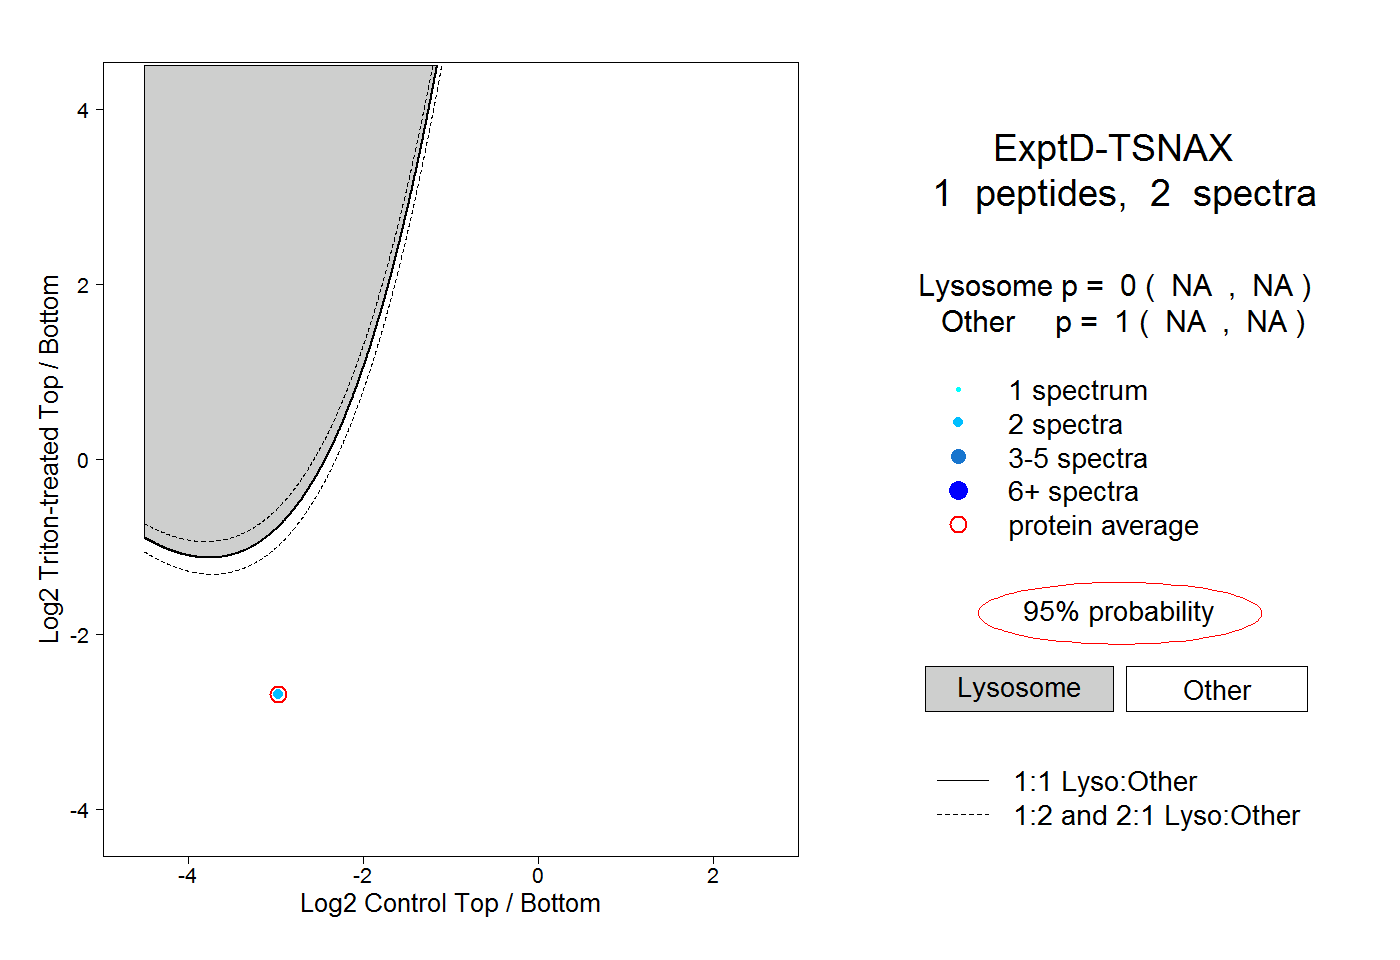 |
0.000 NA | NA |
1.000 NA | NA |