 22
22peptides
spectra
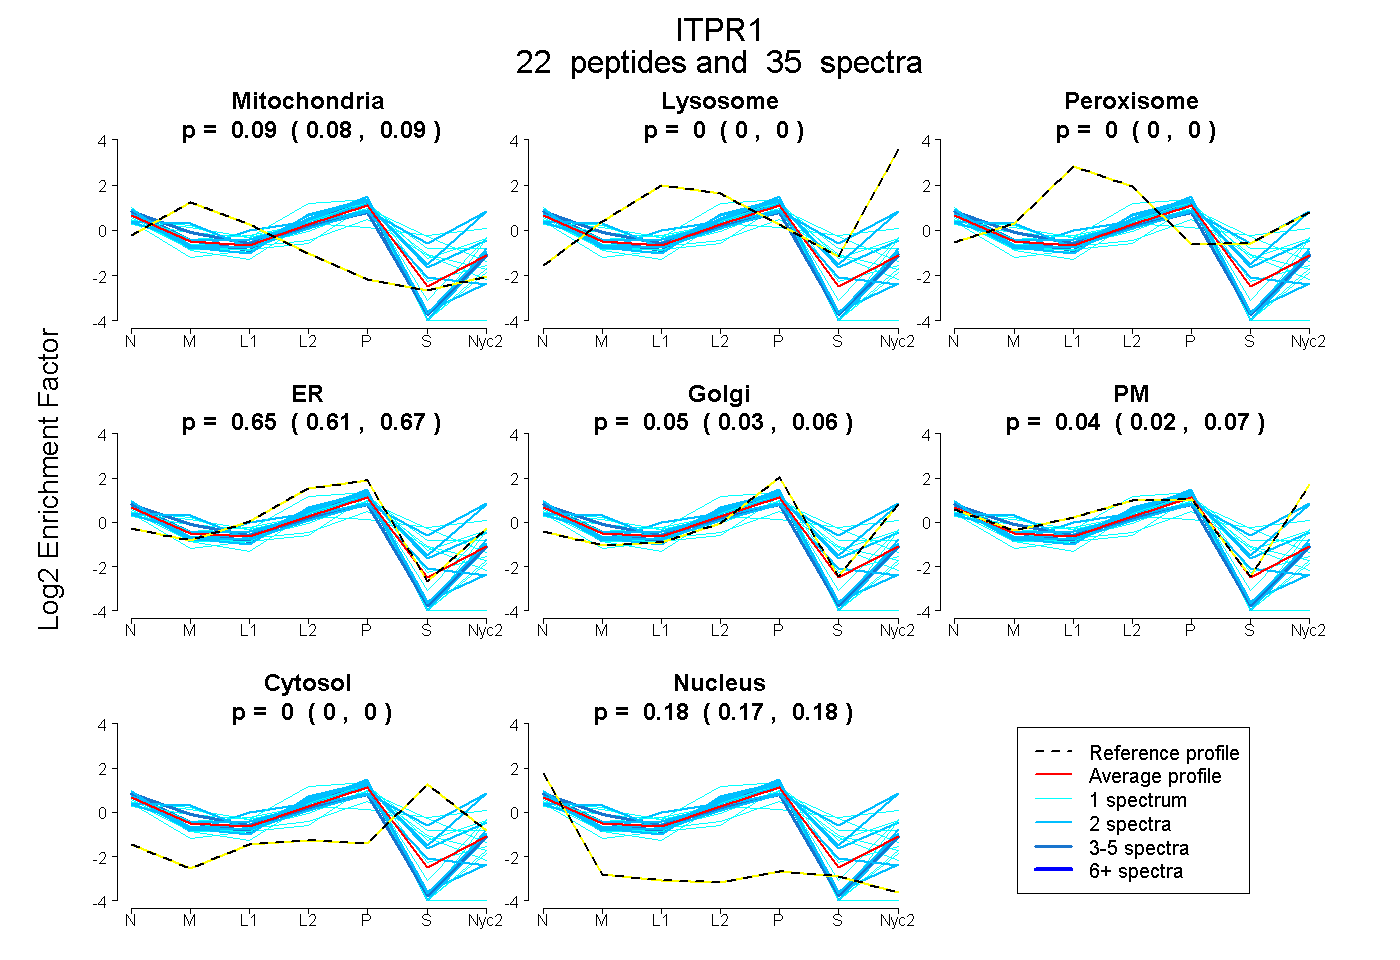
0.080 | 0.093
0.000 | 0.000
0.000 | 0.000
0.615 | 0.669
0.027 | 0.063
0.021 | 0.066
0.000 | 0.000
0.171 | 0.181
5peptides
spectra
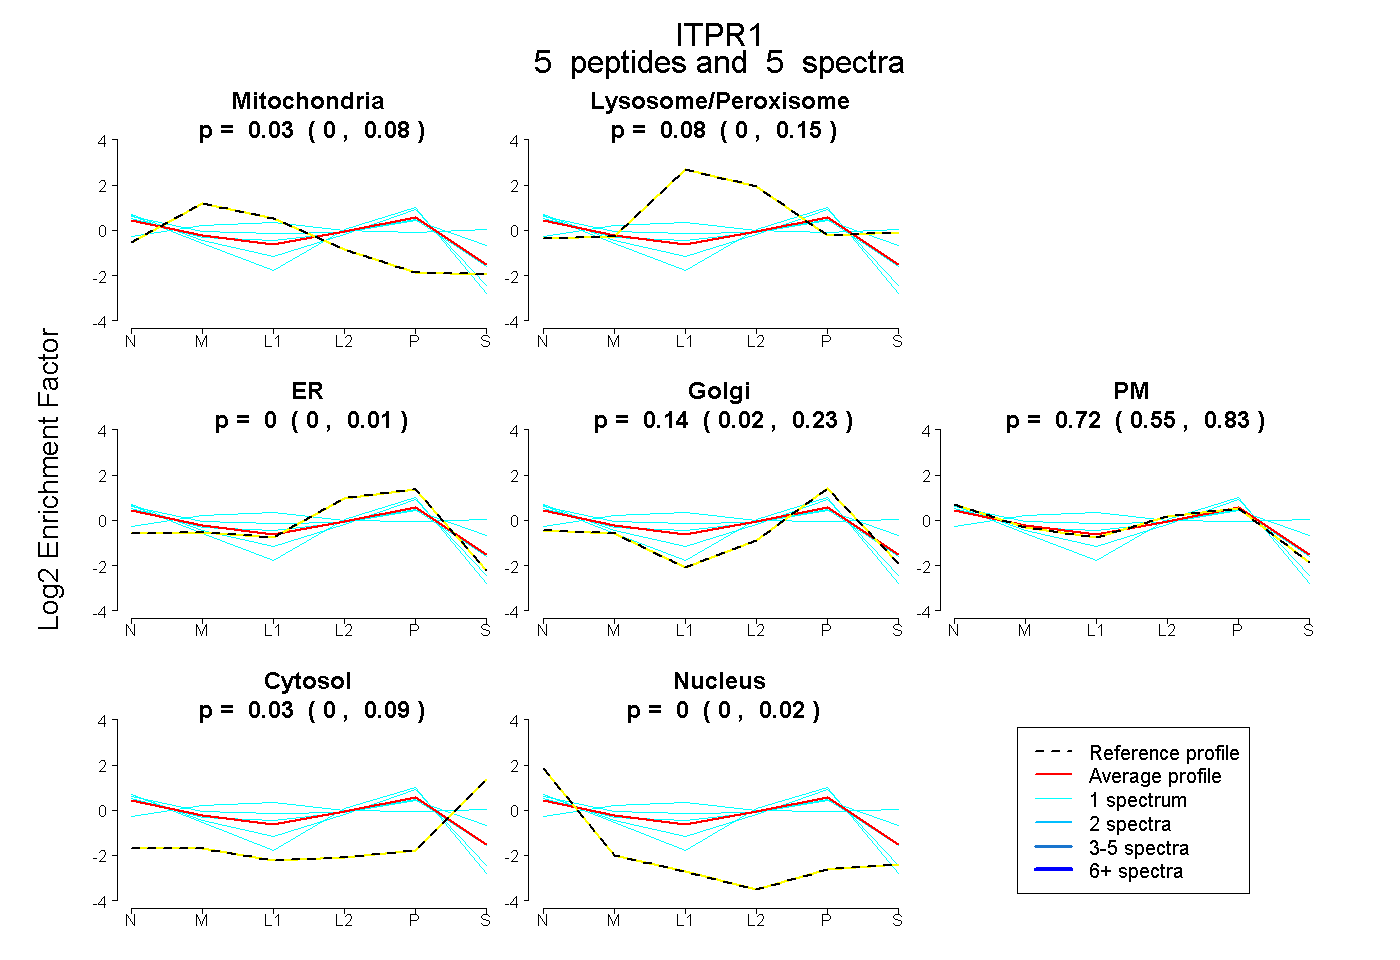
0.000 | 0.080
0.000 | 0.155
0.000 | 0.013
0.021 | 0.231
0.554 | 0.831
0.000 | 0.090
0.000 | 0.025
13peptides
spectra
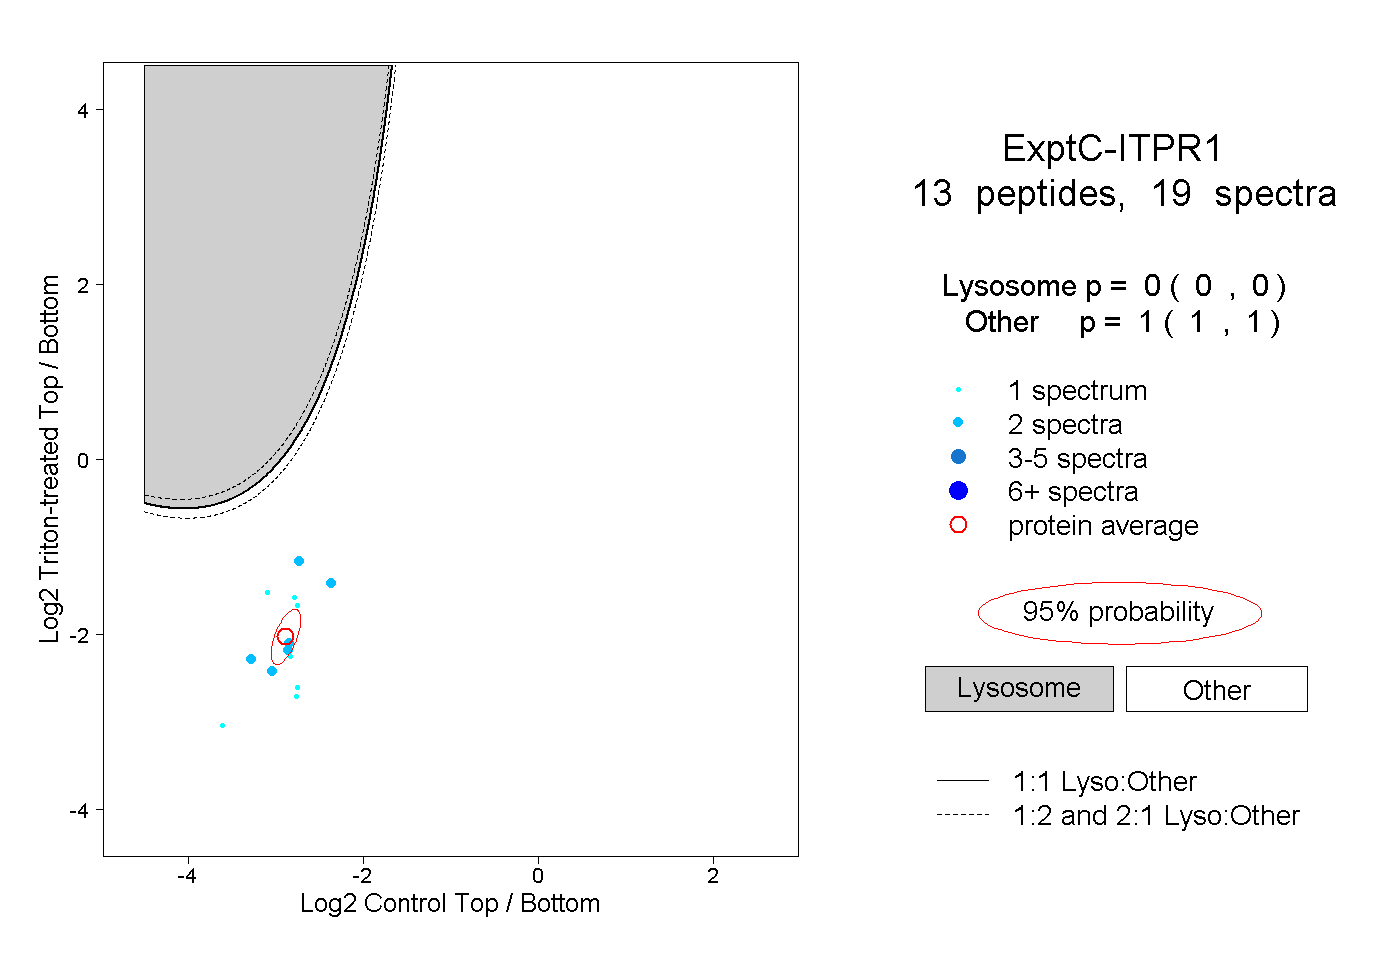
0.000 | 0.000
1.000 | 1.000