 22
22peptides
spectra
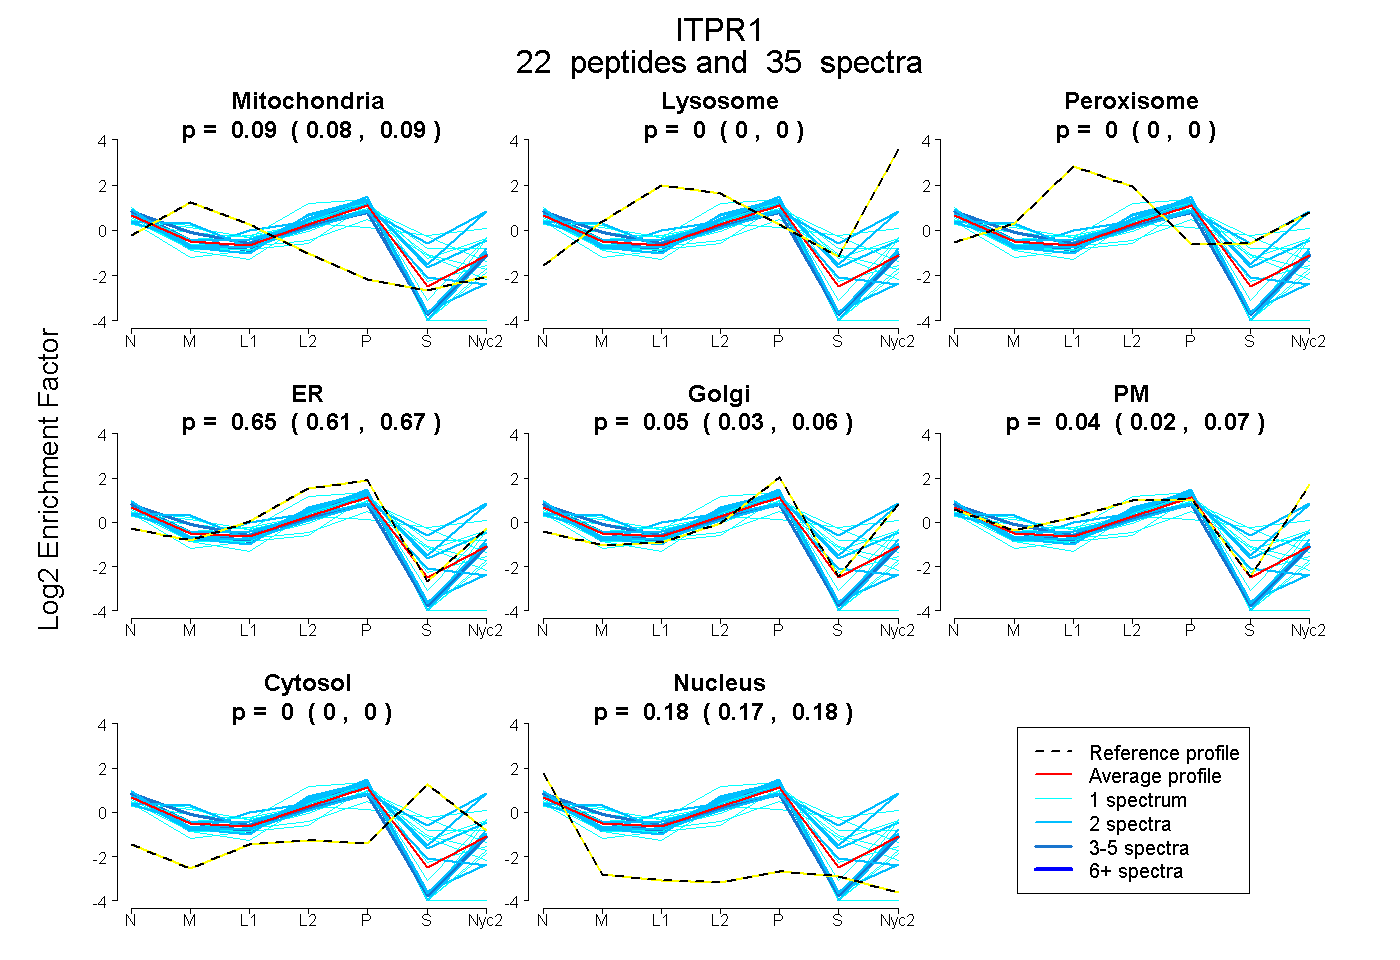
0.080 | 0.093
0.000 | 0.000
0.000 | 0.000
0.615 | 0.669
0.027 | 0.063
0.021 | 0.066
0.000 | 0.000
0.171 | 0.181
| Plot | Mito | Lyso | Perox | ER | Golgi | PM | Cytosol | Nucleus | |||||
| Expt A |
22 peptides |
35 spectra |
|
0.088 0.080 | 0.093 |
0.000 0.000 | 0.000 |
0.000 0.000 | 0.000 |
0.645 0.615 | 0.669 |
0.047 0.027 | 0.063 |
0.044 0.021 | 0.066 |
0.000 0.000 | 0.000 |
0.177 0.171 | 0.181 |
| 1 spectrum, IGLLGHPPHMNVNPQQPA | 0.025 | 0.000 | 0.035 | 0.222 | 0.373 | 0.000 | 0.233 | 0.113 | ||
| 1 spectrum, FLTCDEHR | 0.232 | 0.000 | 0.000 | 0.624 | 0.000 | 0.000 | 0.000 | 0.144 | ||
| 3 spectra, DLDFANDASK | 0.035 | 0.000 | 0.000 | 0.725 | 0.000 | 0.040 | 0.000 | 0.200 | ||
| 1 spectrum, AQPVLYWCAR | 0.044 | 0.000 | 0.000 | 0.741 | 0.000 | 0.000 | 0.000 | 0.215 | ||
| 2 spectra, VVTHEDCIPEVK | 0.302 | 0.000 | 0.000 | 0.547 | 0.000 | 0.000 | 0.000 | 0.151 | ||
| 1 spectrum, ALIASTILR | 0.000 | 0.000 | 0.000 | 0.721 | 0.000 | 0.000 | 0.000 | 0.279 | ||
| 4 spectra, NLDWFPR | 0.181 | 0.000 | 0.000 | 0.573 | 0.000 | 0.083 | 0.000 | 0.163 | ||
| 2 spectra, LFENFLVDICR | 0.000 | 0.000 | 0.000 | 0.734 | 0.000 | 0.000 | 0.000 | 0.266 | ||
| 1 spectrum, LCVQESASVR | 0.000 | 0.000 | 0.000 | 0.547 | 0.000 | 0.000 | 0.372 | 0.080 | ||
| 2 spectra, IVLFMK | 0.000 | 0.000 | 0.000 | 0.734 | 0.018 | 0.061 | 0.000 | 0.187 | ||
| 2 spectra, LEELGDQR | 0.000 | 0.000 | 0.000 | 0.034 | 0.179 | 0.620 | 0.139 | 0.028 | ||
| 2 spectra, QHVFLR | 0.000 | 0.000 | 0.000 | 0.734 | 0.000 | 0.064 | 0.000 | 0.202 | ||
| 1 spectrum, GTITQNER | 0.072 | 0.000 | 0.000 | 0.473 | 0.020 | 0.314 | 0.000 | 0.121 | ||
| 1 spectrum, AMSLVSSDSEGEQNELR | 0.102 | 0.000 | 0.139 | 0.013 | 0.000 | 0.420 | 0.326 | 0.000 | ||
| 1 spectrum, GEMSLAEVQCHLDK | 0.194 | 0.000 | 0.000 | 0.541 | 0.000 | 0.000 | 0.185 | 0.081 | ||
| 1 spectrum, LQDIVSALEDR | 0.000 | 0.000 | 0.000 | 0.717 | 0.000 | 0.000 | 0.000 | 0.283 | ||
| 2 spectra, INDFFLR | 0.000 | 0.000 | 0.000 | 0.792 | 0.000 | 0.000 | 0.000 | 0.208 | ||
| 2 spectra, SELWVYK | 0.000 | 0.000 | 0.046 | 0.000 | 0.069 | 0.609 | 0.277 | 0.000 | ||
| 2 spectra, DVVCQR | 0.000 | 0.000 | 0.107 | 0.465 | 0.034 | 0.200 | 0.059 | 0.136 | ||
| 1 spectrum, DLQNFLR | 0.000 | 0.000 | 0.000 | 0.387 | 0.145 | 0.205 | 0.176 | 0.087 | ||
| 1 spectrum, EETLLNVIK | 0.326 | 0.000 | 0.000 | 0.410 | 0.000 | 0.000 | 0.153 | 0.110 | ||
| 1 spectrum, ELVEVIK | 0.000 | 0.000 | 0.000 | 0.439 | 0.071 | 0.296 | 0.000 | 0.194 |
| Plot | Mito | Lyso or Perox | ER | Golgi | PM | Cytosol | Nucleus | ||||||
| Expt B |
5 peptides |
5 spectra |
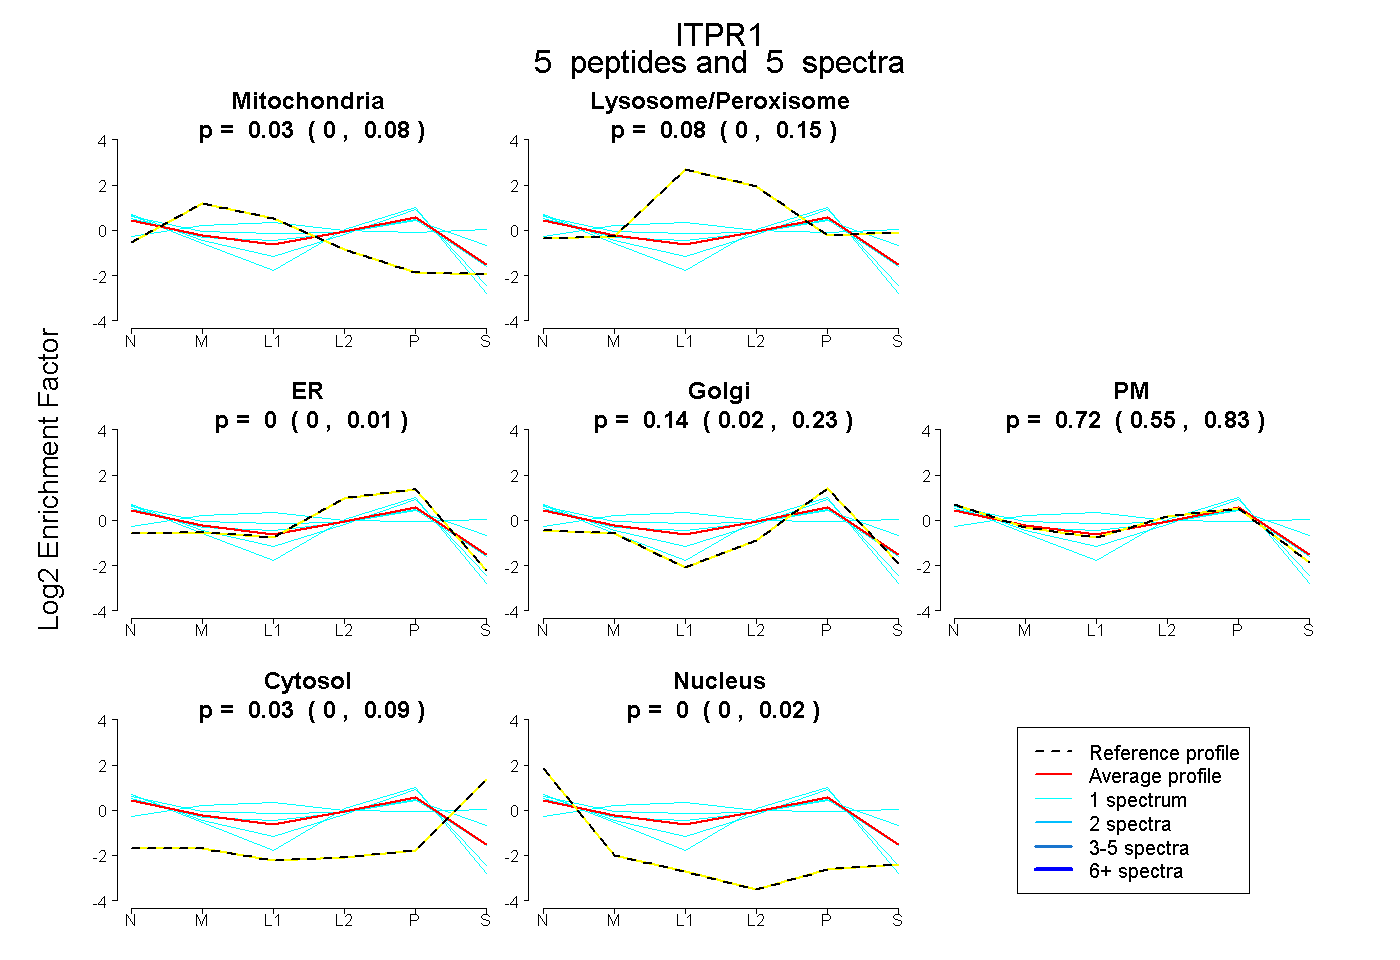 |
0.025 0.000 | 0.080 |
0.084 0.000 | 0.155 |
0.000 0.000 | 0.013 |
0.140 0.021 | 0.231 |
0.719 0.554 | 0.831 |
0.032 0.000 | 0.090 |
0.000 0.000 | 0.025 |
|||
| Plot | Lyso | Other | |||||||||||
| Expt C |
13 peptides |
19 spectra |
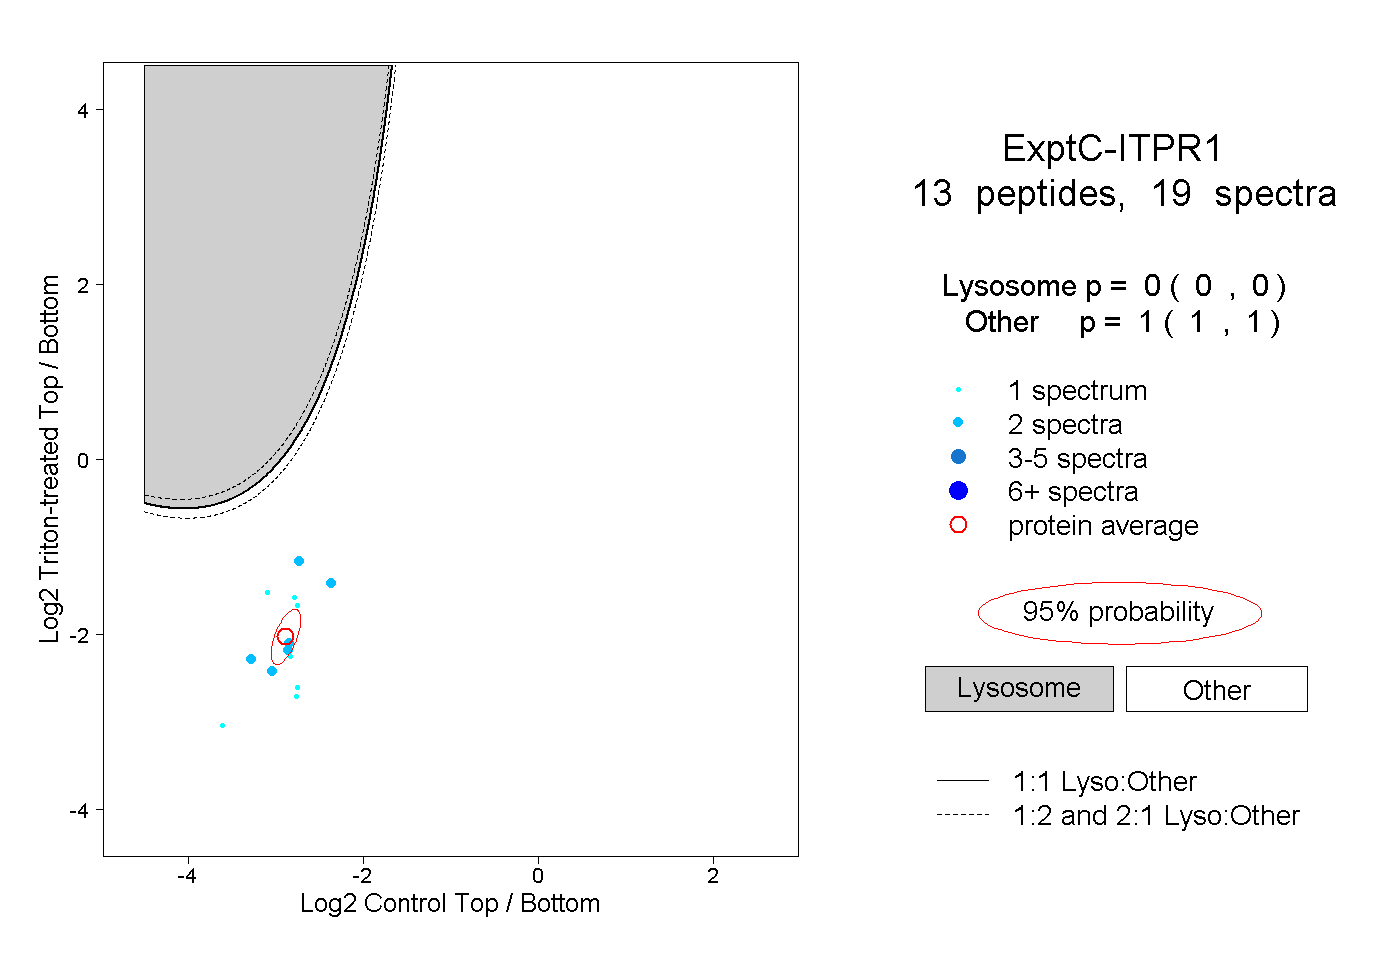 |
0.000 0.000 | 0.000 |
1.000 1.000 | 1.000 |