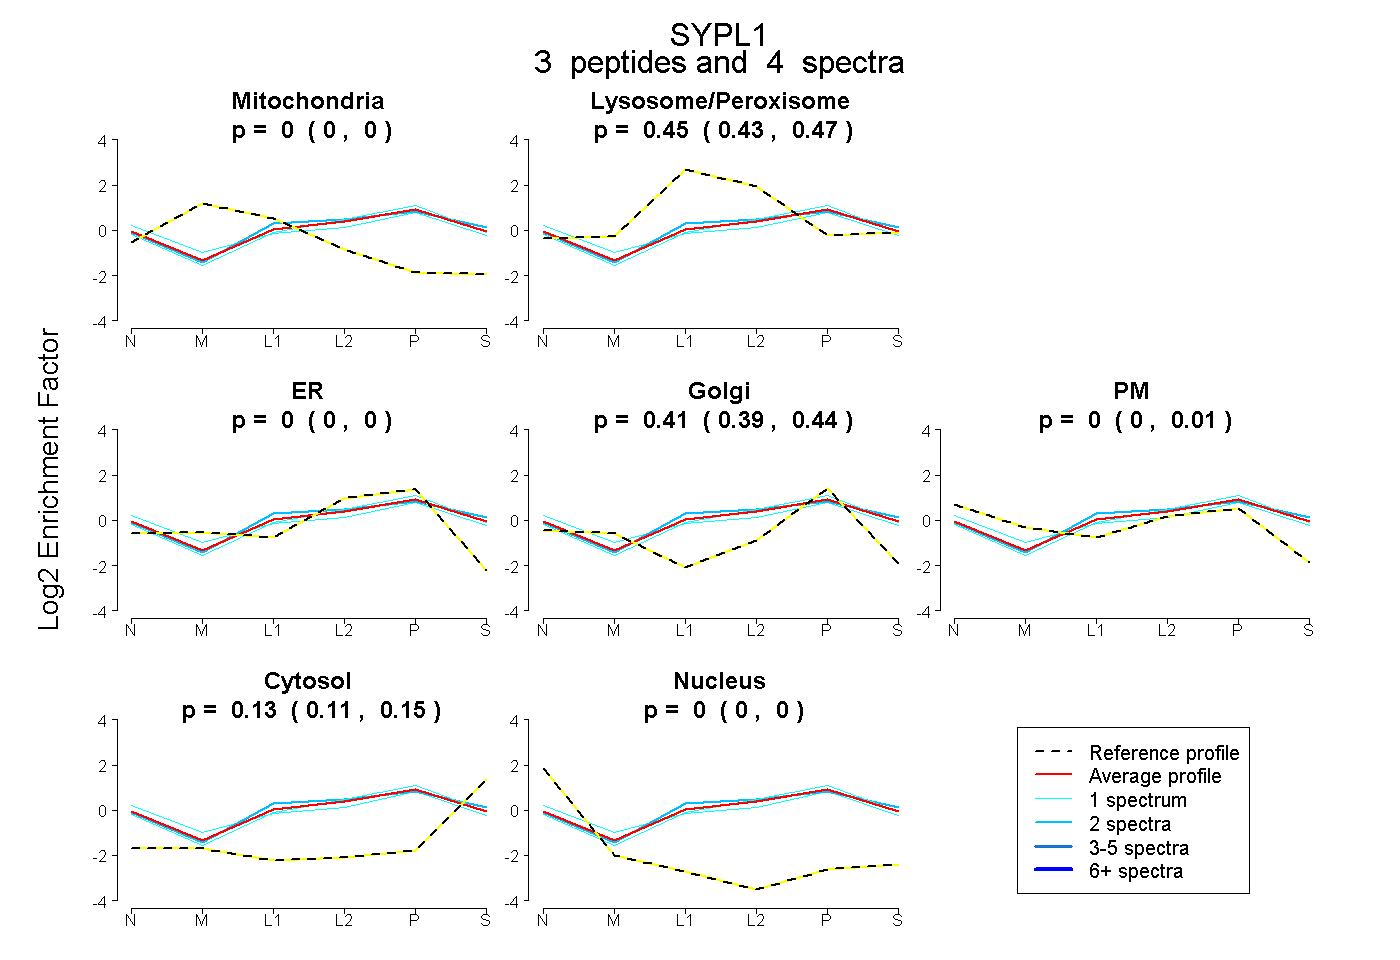
 3
3peptides
spectra

0.000 | 0.000
0.373 | 0.414
0.000 | 0.000
0.000 | 0.000
0.335 | 0.367
0.080 | 0.114
0.136 | 0.168
0.000 | 0.000
3peptides
spectra
0.000 | 0.000
0.430 | 0.473
0.000 | 0.000
0.388 | 0.438
0.000 | 0.005
0.109 | 0.148
0.000 | 0.000
4peptides
spectra
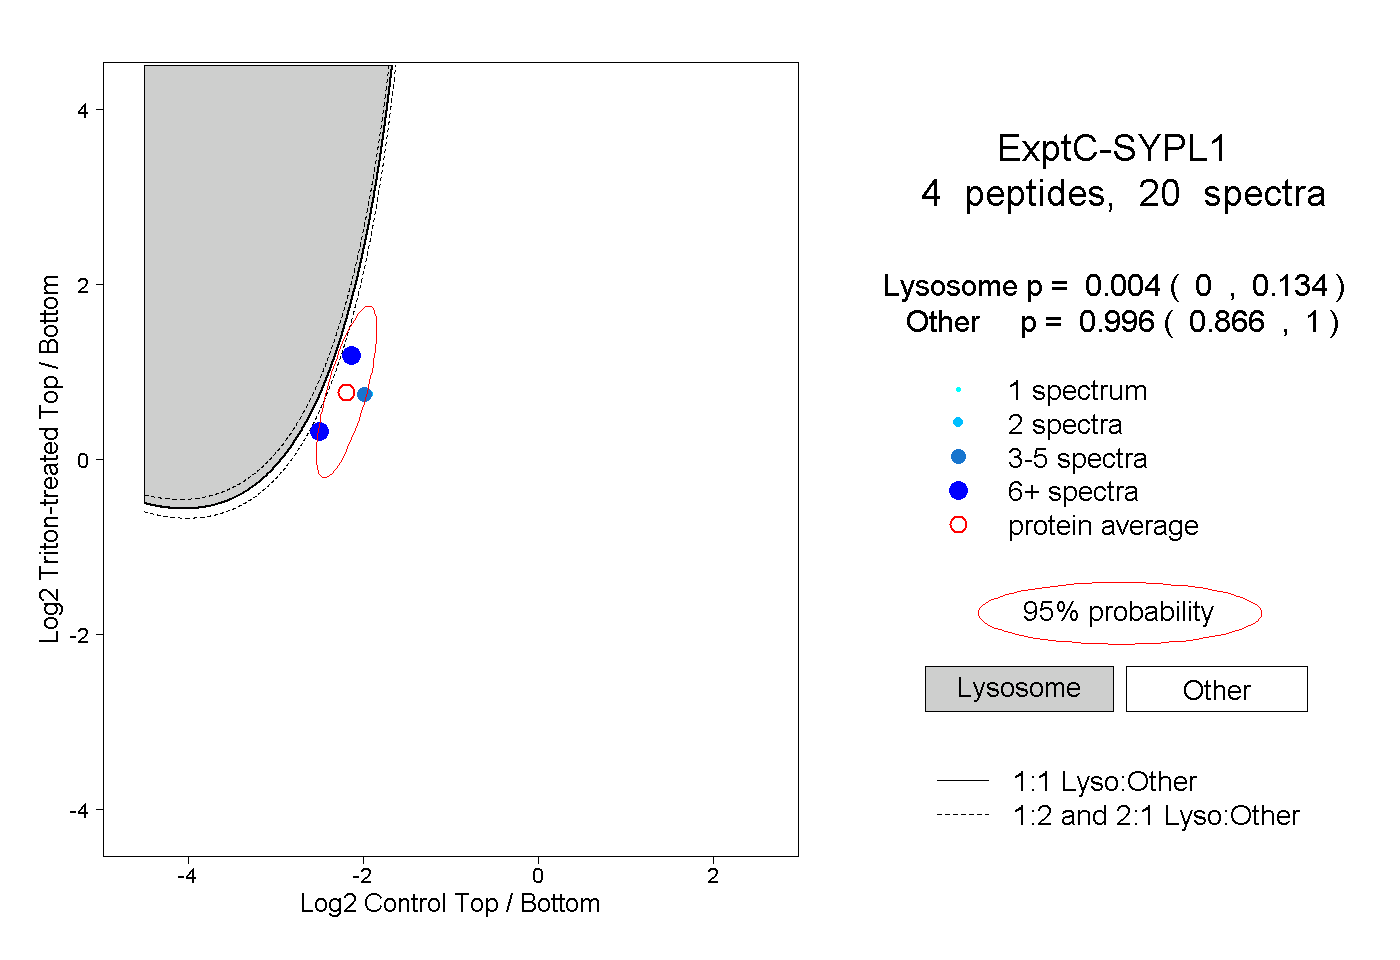
0.000 | 0.134
0.866 | 1.000
1peptide
spectrum
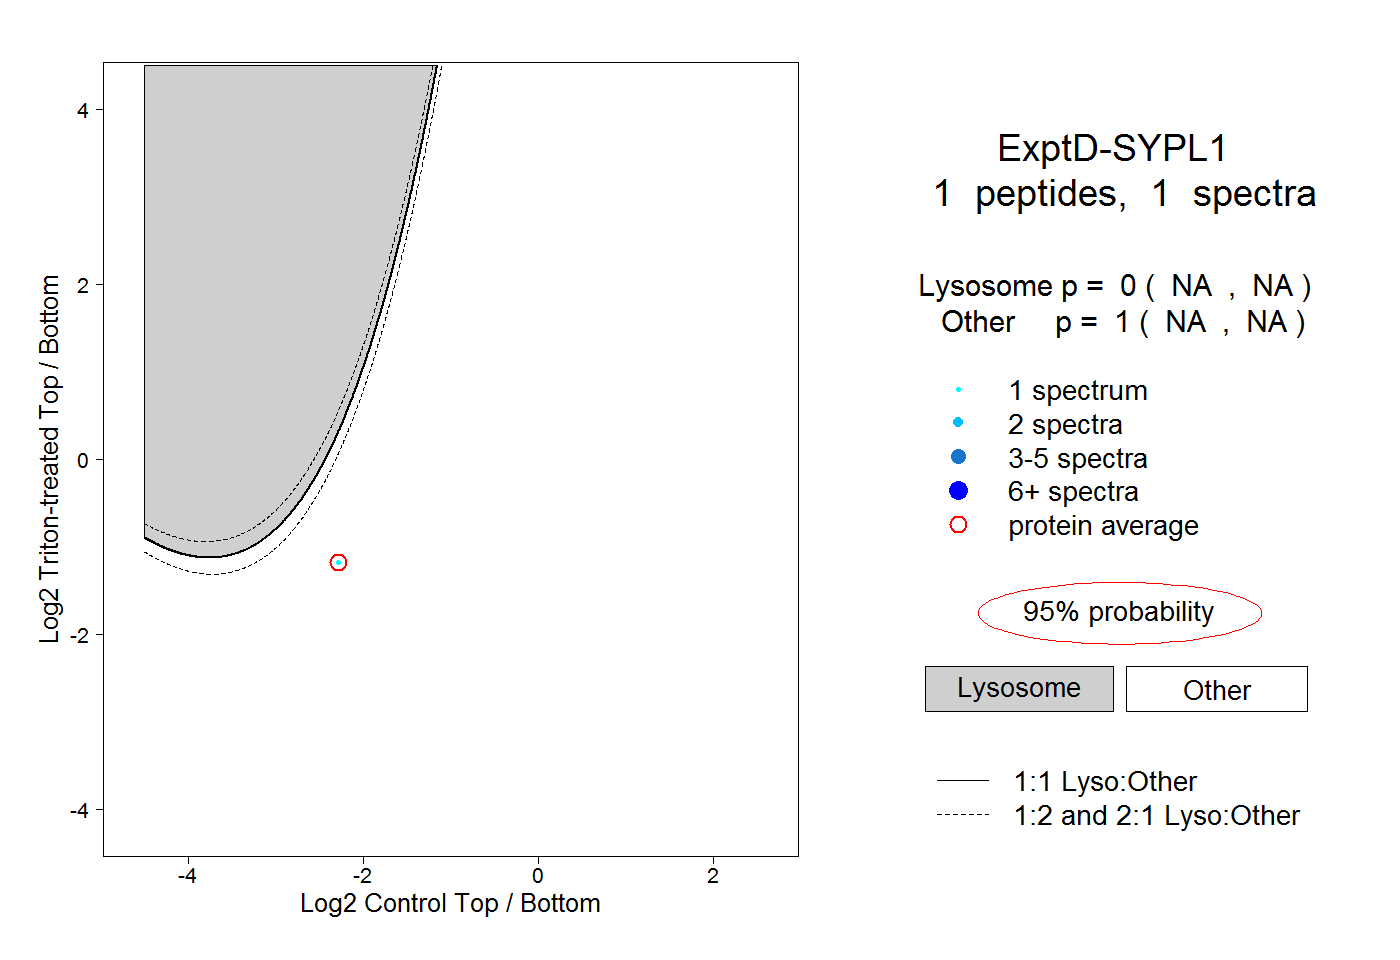
NA | NA
NA | NA