 3
3peptides
spectra

0.000 | 0.000
0.373 | 0.414
0.000 | 0.000
0.000 | 0.000
0.335 | 0.367
0.080 | 0.114
0.136 | 0.168
0.000 | 0.000
| Plot | Mito | Lyso | Perox | ER | Golgi | PM | Cytosol | Nucleus | |||||
| Expt A |
3 peptides |
11 spectra |
|
0.000 0.000 | 0.000 |
0.395 0.373 | 0.414 |
0.000 0.000 | 0.000 |
0.000 0.000 | 0.000 |
0.353 0.335 | 0.367 |
0.099 0.080 | 0.114 |
0.154 0.136 | 0.168 |
0.000 0.000 | 0.000 |
| 6 spectra, TITATFGYPFR | 0.000 | 0.449 | 0.000 | 0.000 | 0.345 | 0.117 | 0.089 | 0.000 | ||
| 3 spectra, ALTDIK | 0.000 | 0.430 | 0.000 | 0.000 | 0.345 | 0.076 | 0.150 | 0.000 | ||
| 2 spectra, IVEELDPCK | 0.000 | 0.300 | 0.000 | 0.000 | 0.367 | 0.100 | 0.233 | 0.000 |
| Plot | Mito | Lyso or Perox | ER | Golgi | PM | Cytosol | Nucleus | ||||||
| Expt B |
3 peptides |
4 spectra |
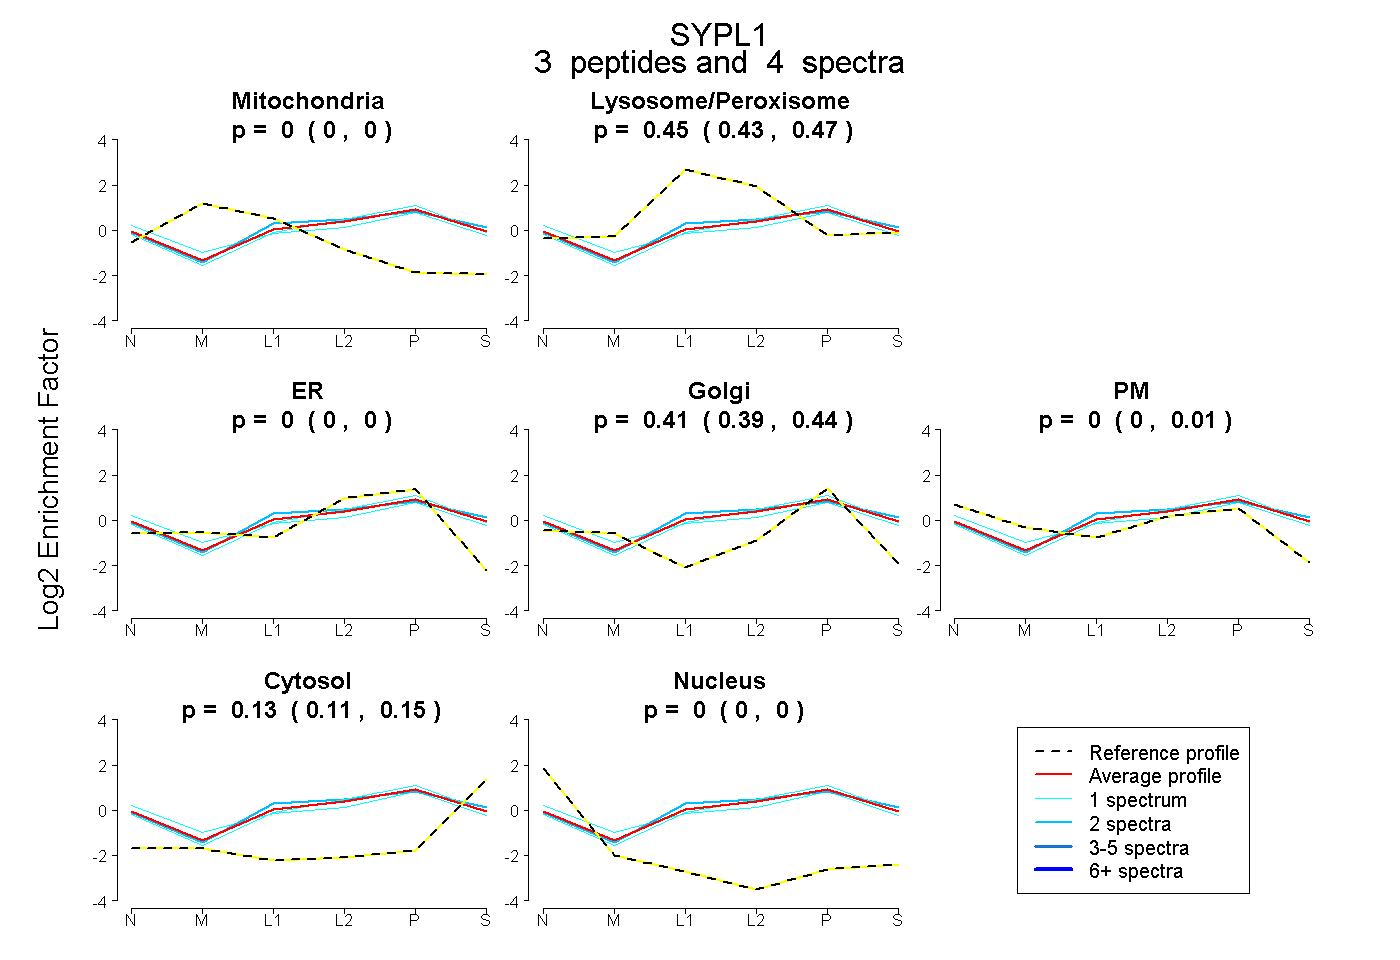 |
0.000 0.000 | 0.000 |
0.455 0.430 | 0.473 |
0.000 0.000 | 0.000 |
0.415 0.388 | 0.438 |
0.000 0.000 | 0.005 |
0.130 0.109 | 0.148 |
0.000 0.000 | 0.000 |
|||
| Plot | Lyso | Other | |||||||||||
| Expt C |
4 peptides |
20 spectra |
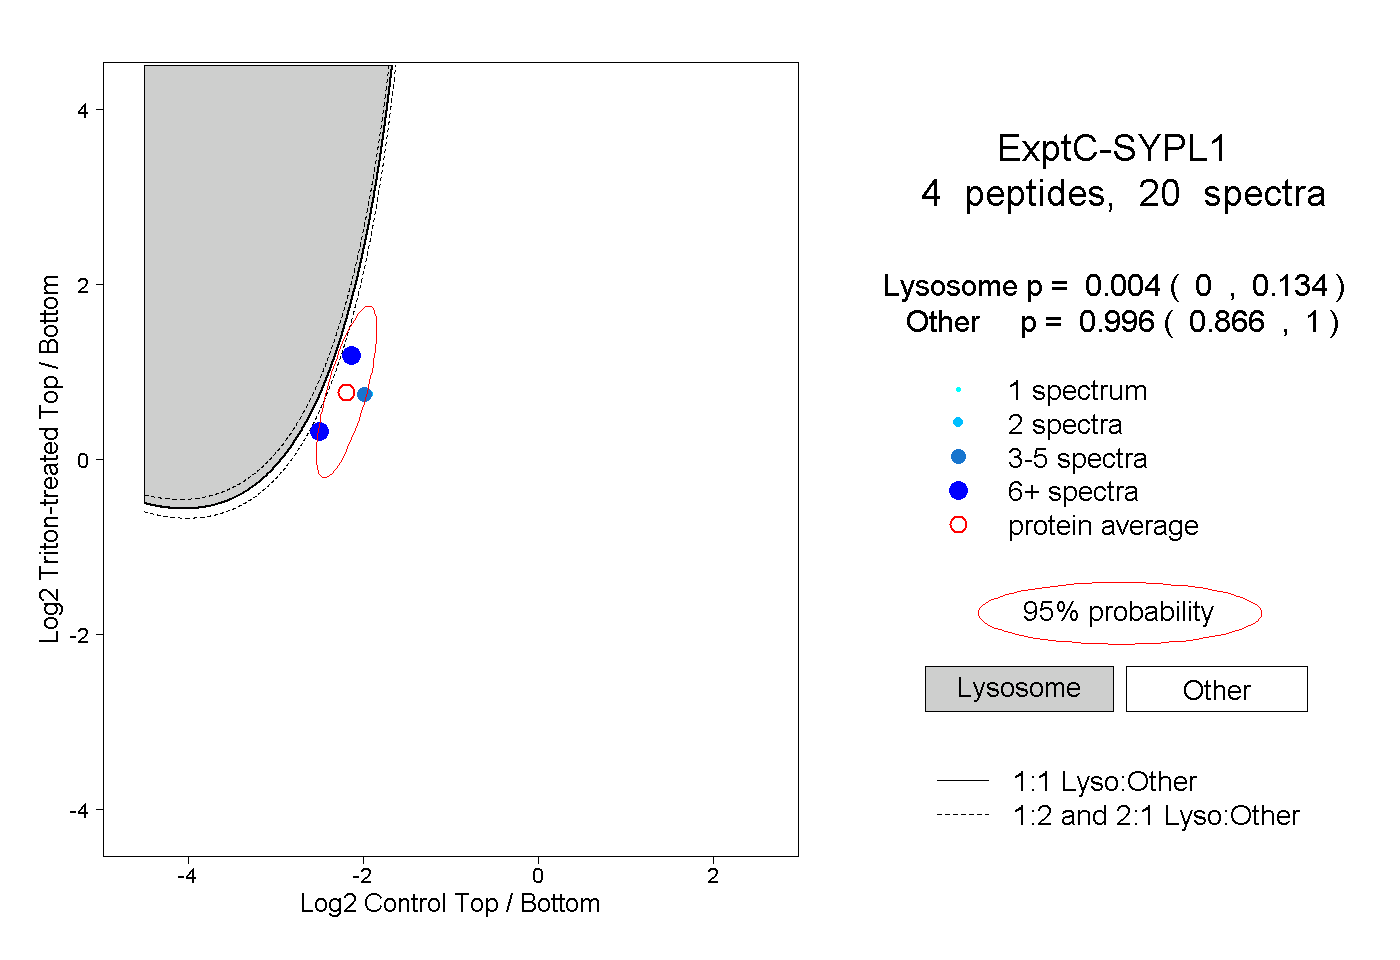 |
0.004 0.000 | 0.134 |
0.996 0.866 | 1.000 |
||||||||
| Plot | Lyso | Other | |||||||||||
| Expt D |
1 peptide |
1 spectrum |
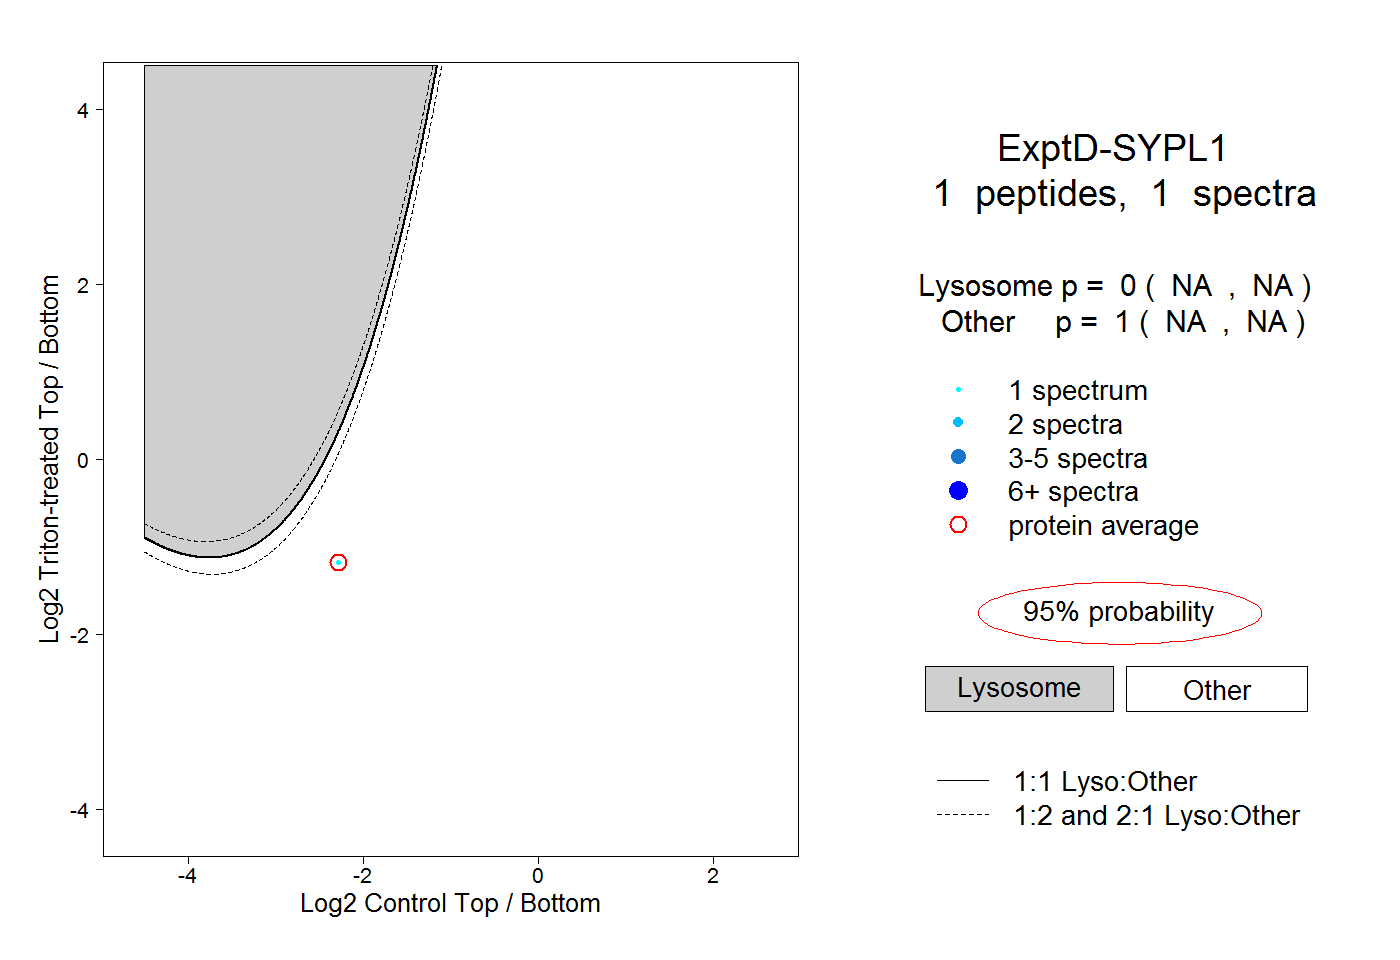 |
0.000 NA | NA |
1.000 NA | NA |