 11
11peptides
spectra
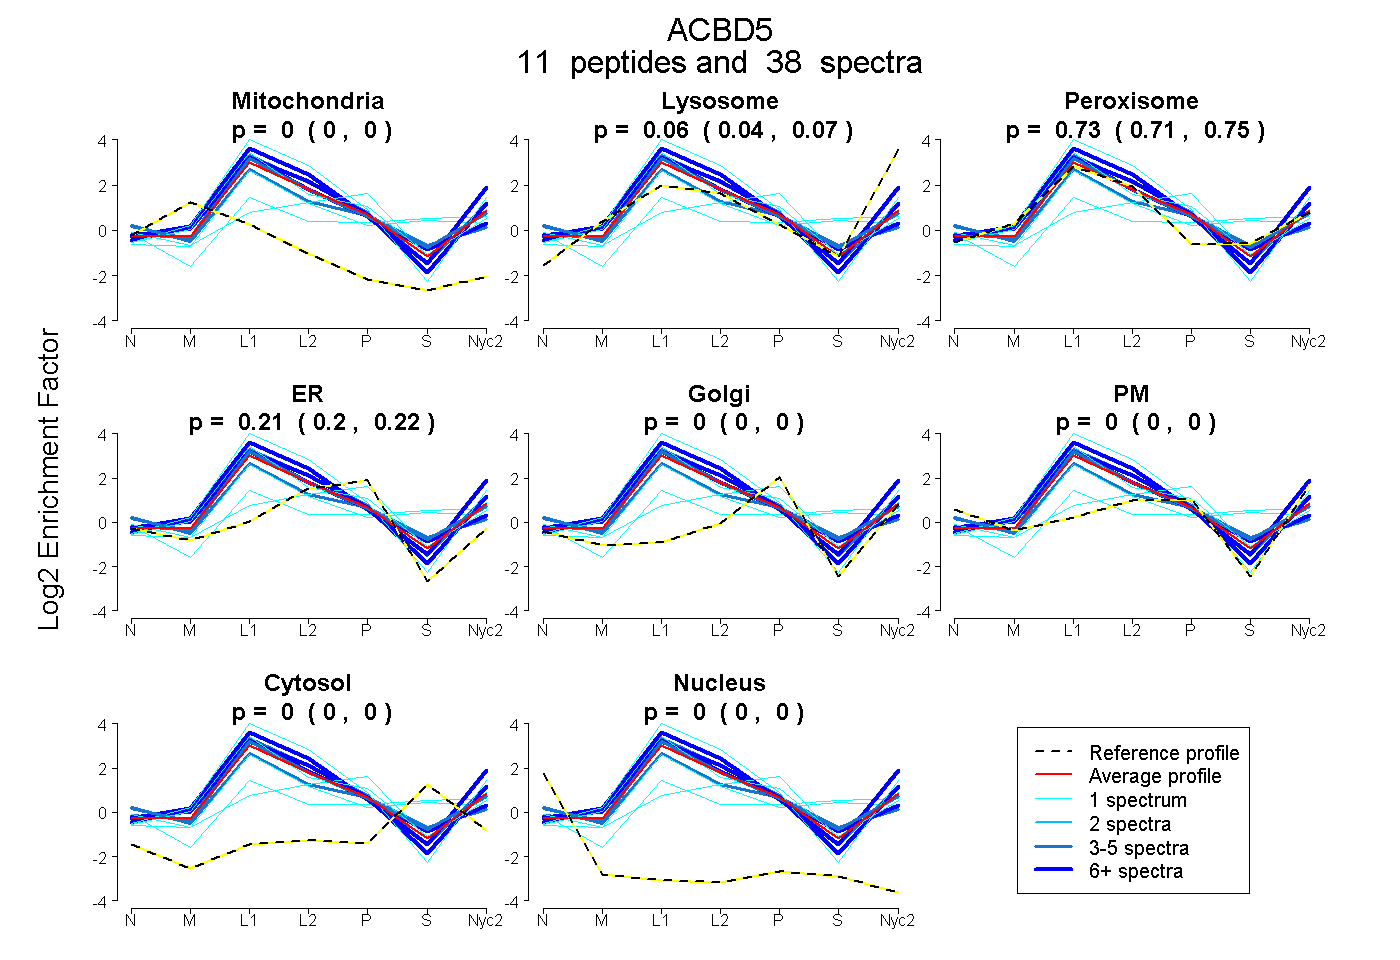
0.000 | 0.000
0.042 | 0.071
0.711 | 0.745
0.201 | 0.223
0.000 | 0.000
0.000 | 0.001
0.000 | 0.000
0.000 | 0.000
6peptides
spectra
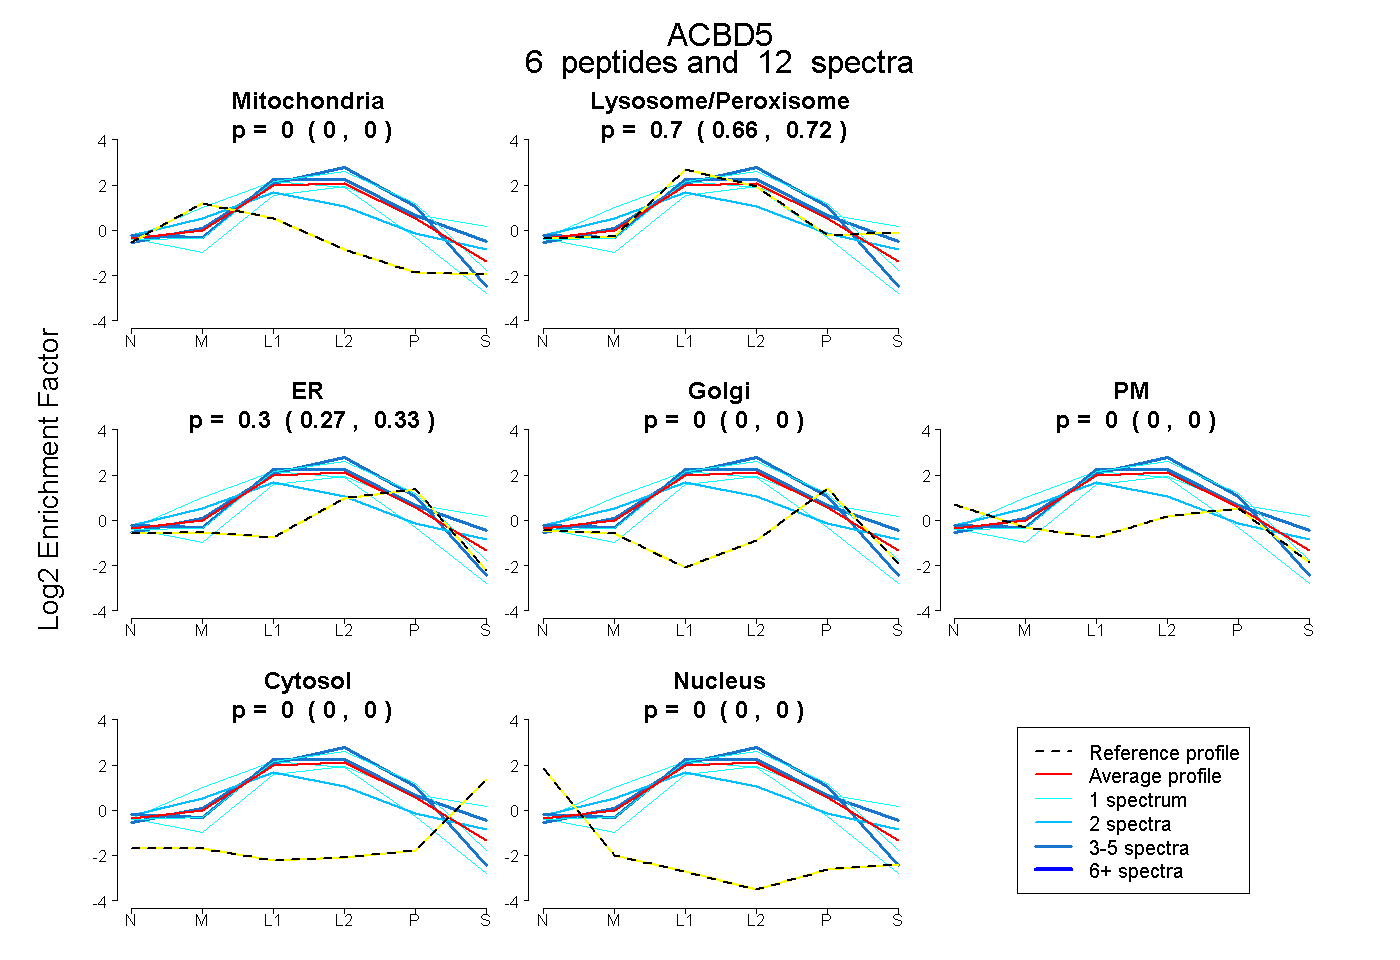
0.000 | 0.000
0.659 | 0.723
0.273 | 0.333
0.000 | 0.000
0.000 | 0.000
0.000 | 0.000
0.000 | 0.000
12peptides
spectra
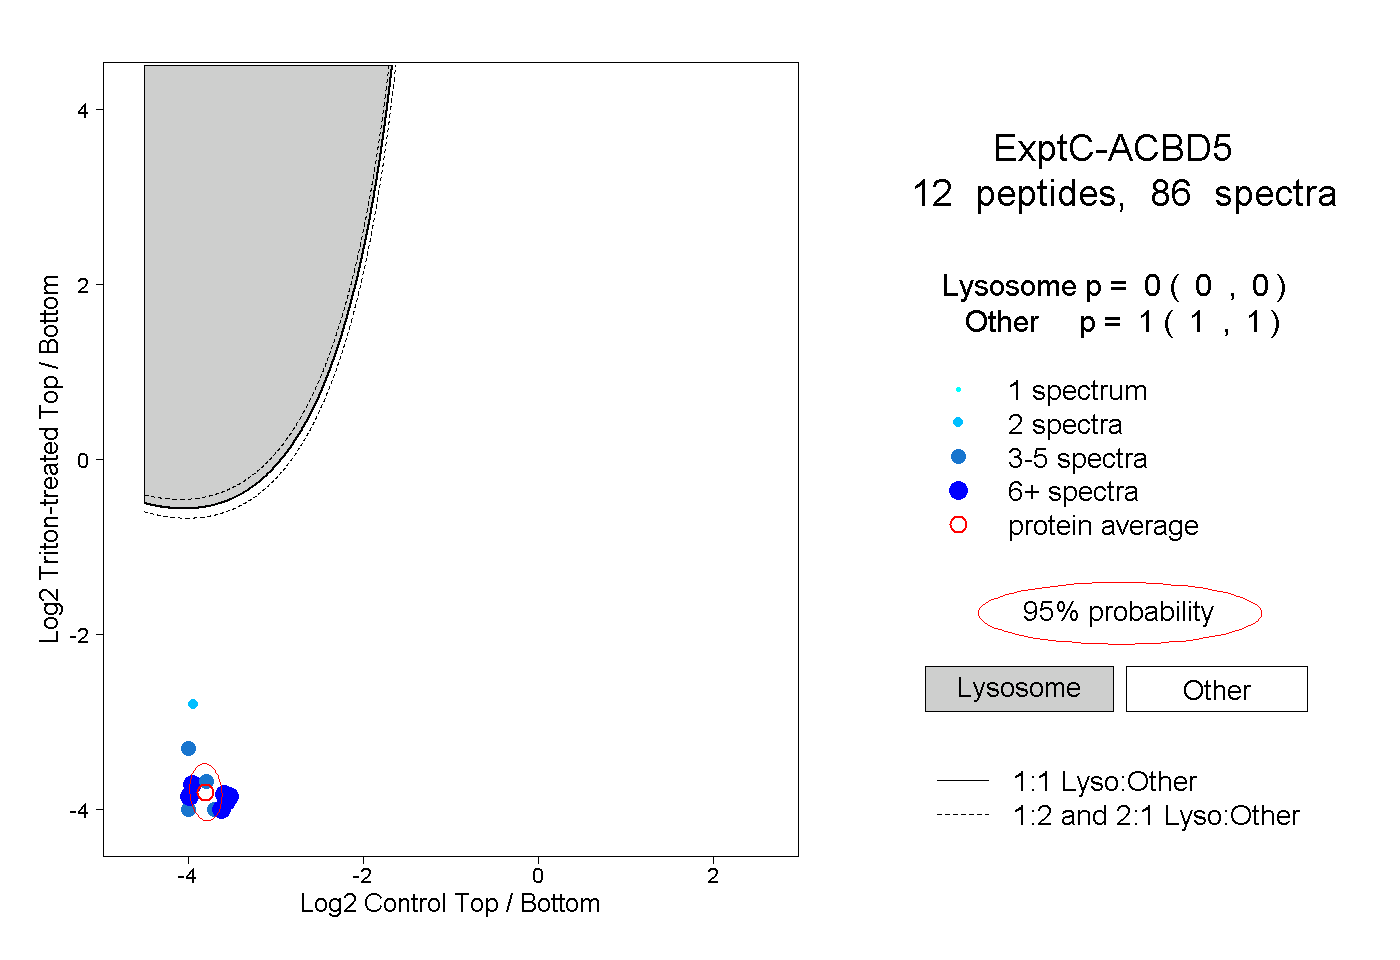
0.000 | 0.000
1.000 | 1.000
3peptides
spectra
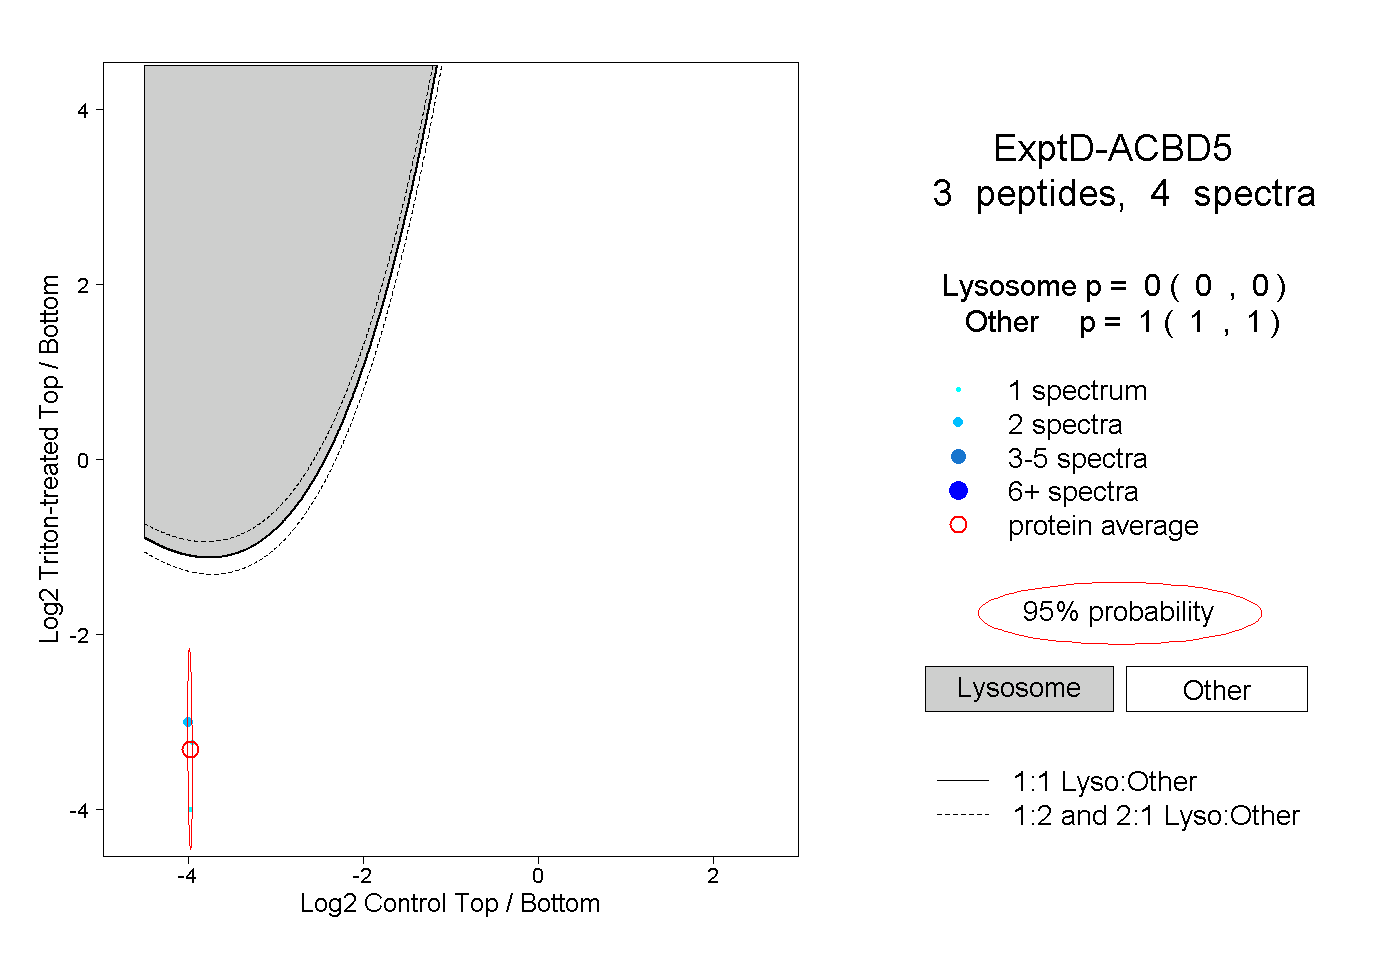
0.000 | 0.000
1.000 | 1.000