 11
11peptides
spectra
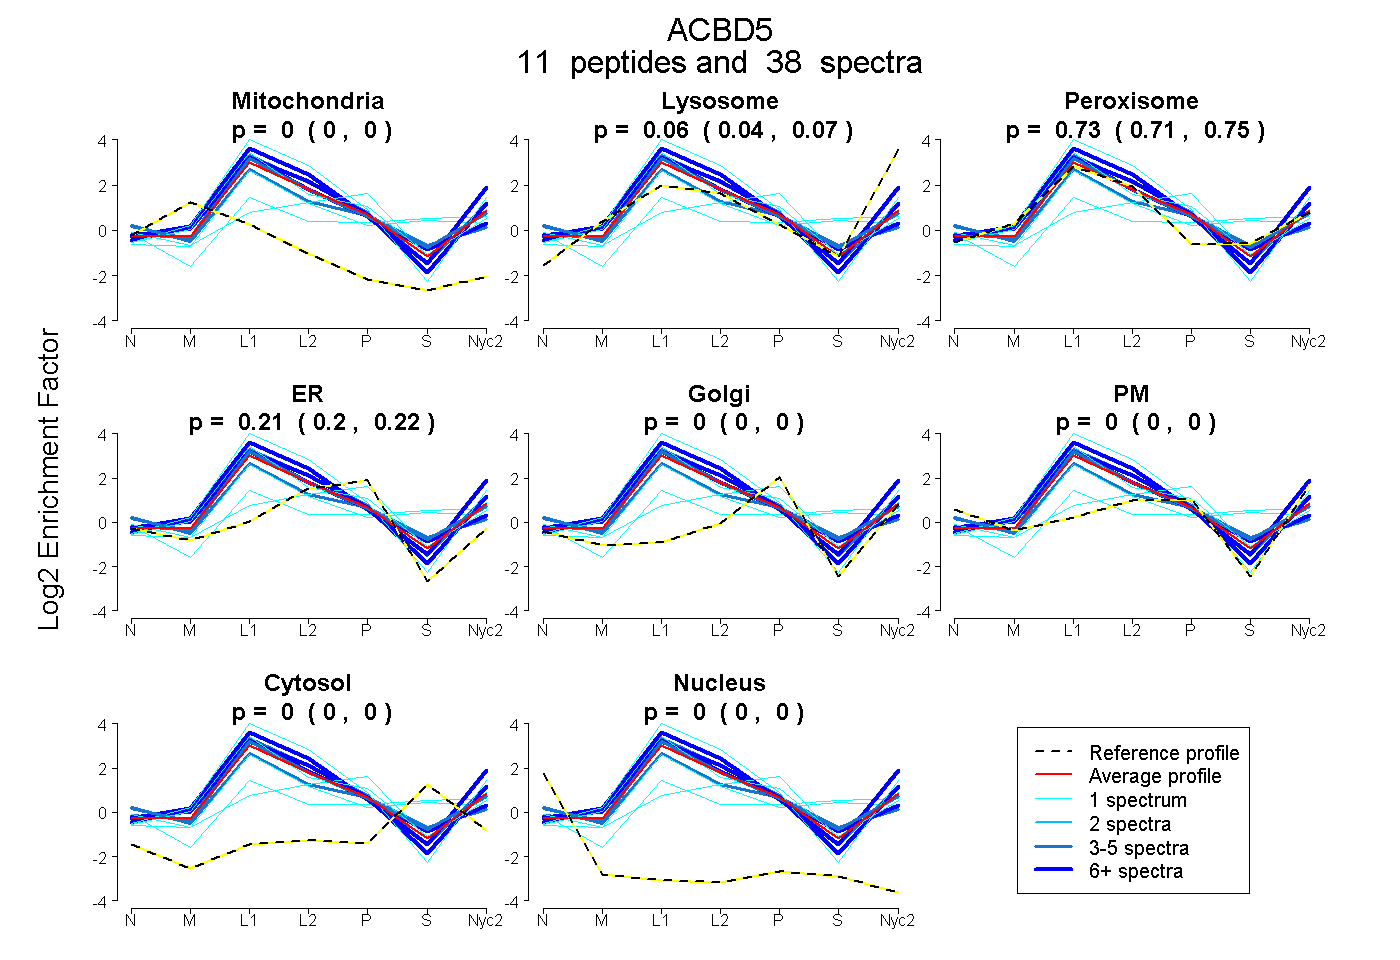
0.000 | 0.000
0.042 | 0.071
0.711 | 0.745
0.201 | 0.223
0.000 | 0.000
0.000 | 0.001
0.000 | 0.000
0.000 | 0.000
| Plot | Mito | Lyso | Perox | ER | Golgi | PM | Cytosol | Nucleus | |||||
| Expt A |
11 peptides |
38 spectra |
|
0.000 0.000 | 0.000 |
0.058 0.042 | 0.071 |
0.730 0.711 | 0.745 |
0.213 0.201 | 0.223 |
0.000 0.000 | 0.000 |
0.000 0.000 | 0.001 |
0.000 0.000 | 0.000 |
0.000 0.000 | 0.000 |
| 3 spectra, DSFAQDSDIHTDSSR | 0.000 | 0.000 | 0.729 | 0.248 | 0.000 | 0.000 | 0.004 | 0.019 | ||
| 4 spectra, SVYETR | 0.000 | 0.000 | 0.830 | 0.153 | 0.000 | 0.017 | 0.000 | 0.000 | ||
| 1 spectrum, QVGSGGDGER | 0.000 | 0.237 | 0.644 | 0.119 | 0.000 | 0.000 | 0.000 | 0.000 | ||
| 6 spectra, GSLNEQIALVLIR | 0.000 | 0.348 | 0.625 | 0.027 | 0.000 | 0.000 | 0.000 | 0.000 | ||
| 1 spectrum, FEAAVK | 0.000 | 0.000 | 0.811 | 0.006 | 0.000 | 0.000 | 0.183 | 0.000 | ||
| 1 spectrum, WDAWSSLGDMTK | 0.000 | 0.008 | 0.791 | 0.201 | 0.000 | 0.000 | 0.000 | 0.000 | ||
| 1 spectrum, NGSFQPTNEMMLR | 0.000 | 0.068 | 0.308 | 0.219 | 0.367 | 0.039 | 0.000 | 0.000 | ||
| 6 spectra, LSRPGFWDPIGR | 0.000 | 0.000 | 0.838 | 0.162 | 0.000 | 0.000 | 0.000 | 0.000 | ||
| 1 spectrum, EEAMIAYVEEMK | 0.000 | 0.000 | 0.502 | 0.000 | 0.107 | 0.056 | 0.335 | 0.000 | ||
| 3 spectra, GGESEDISGVR | 0.000 | 0.124 | 0.688 | 0.188 | 0.000 | 0.000 | 0.000 | 0.000 | ||
| 11 spectra, LQEDMQNVLQR | 0.000 | 0.170 | 0.632 | 0.197 | 0.000 | 0.000 | 0.000 | 0.000 |
| Plot | Mito | Lyso or Perox | ER | Golgi | PM | Cytosol | Nucleus | ||||||
| Expt B |
6 peptides |
12 spectra |
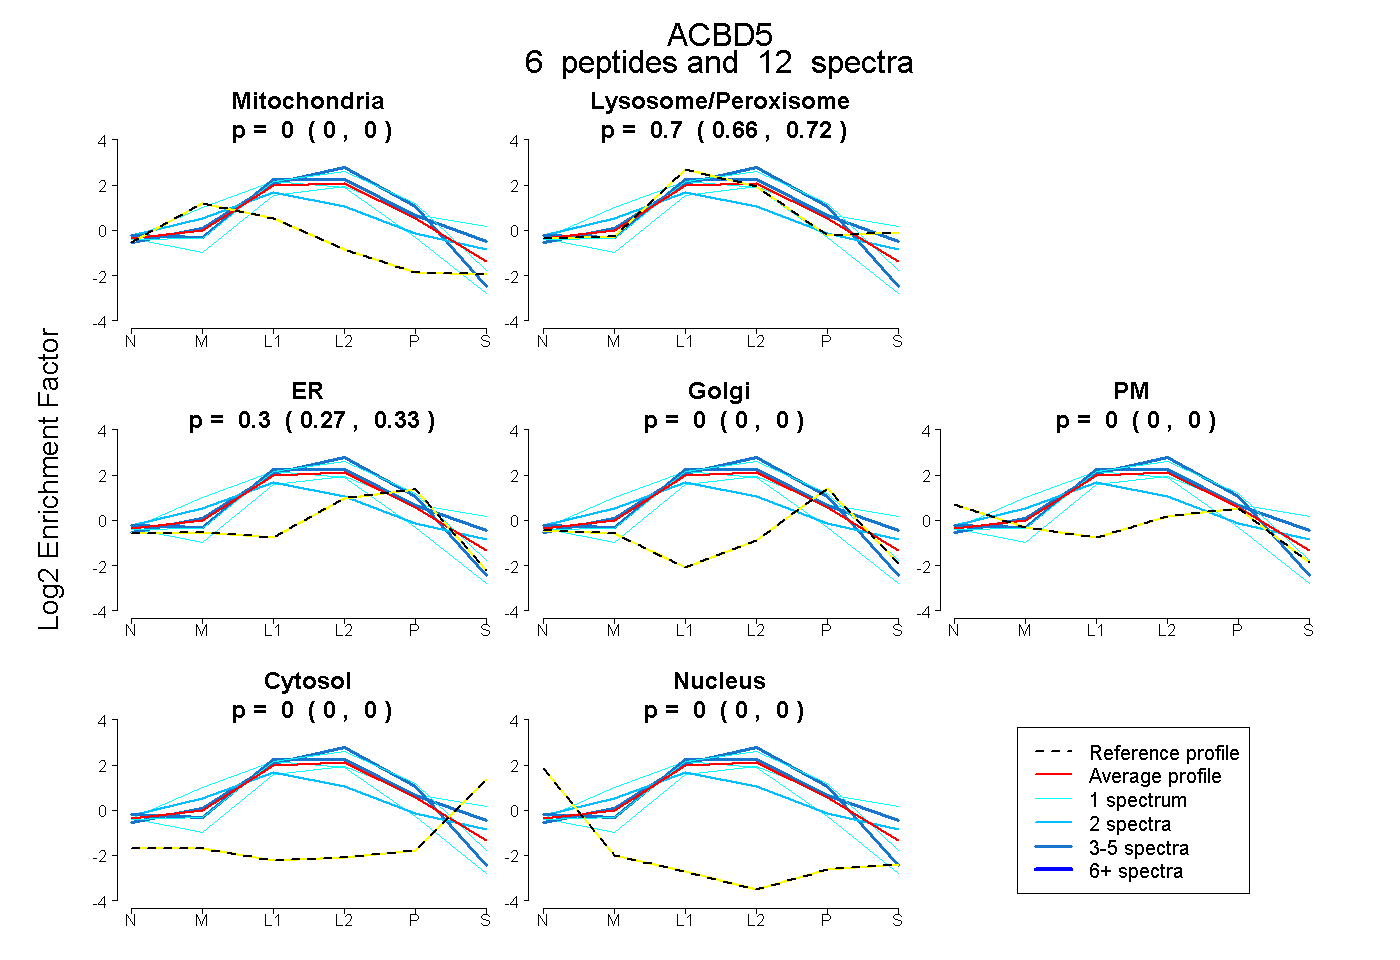 |
0.000 0.000 | 0.000 |
0.695 0.659 | 0.723 |
0.305 0.273 | 0.333 |
0.000 0.000 | 0.000 |
0.000 0.000 | 0.000 |
0.000 0.000 | 0.000 |
0.000 0.000 | 0.000 |
|||
| Plot | Lyso | Other | |||||||||||
| Expt C |
12 peptides |
86 spectra |
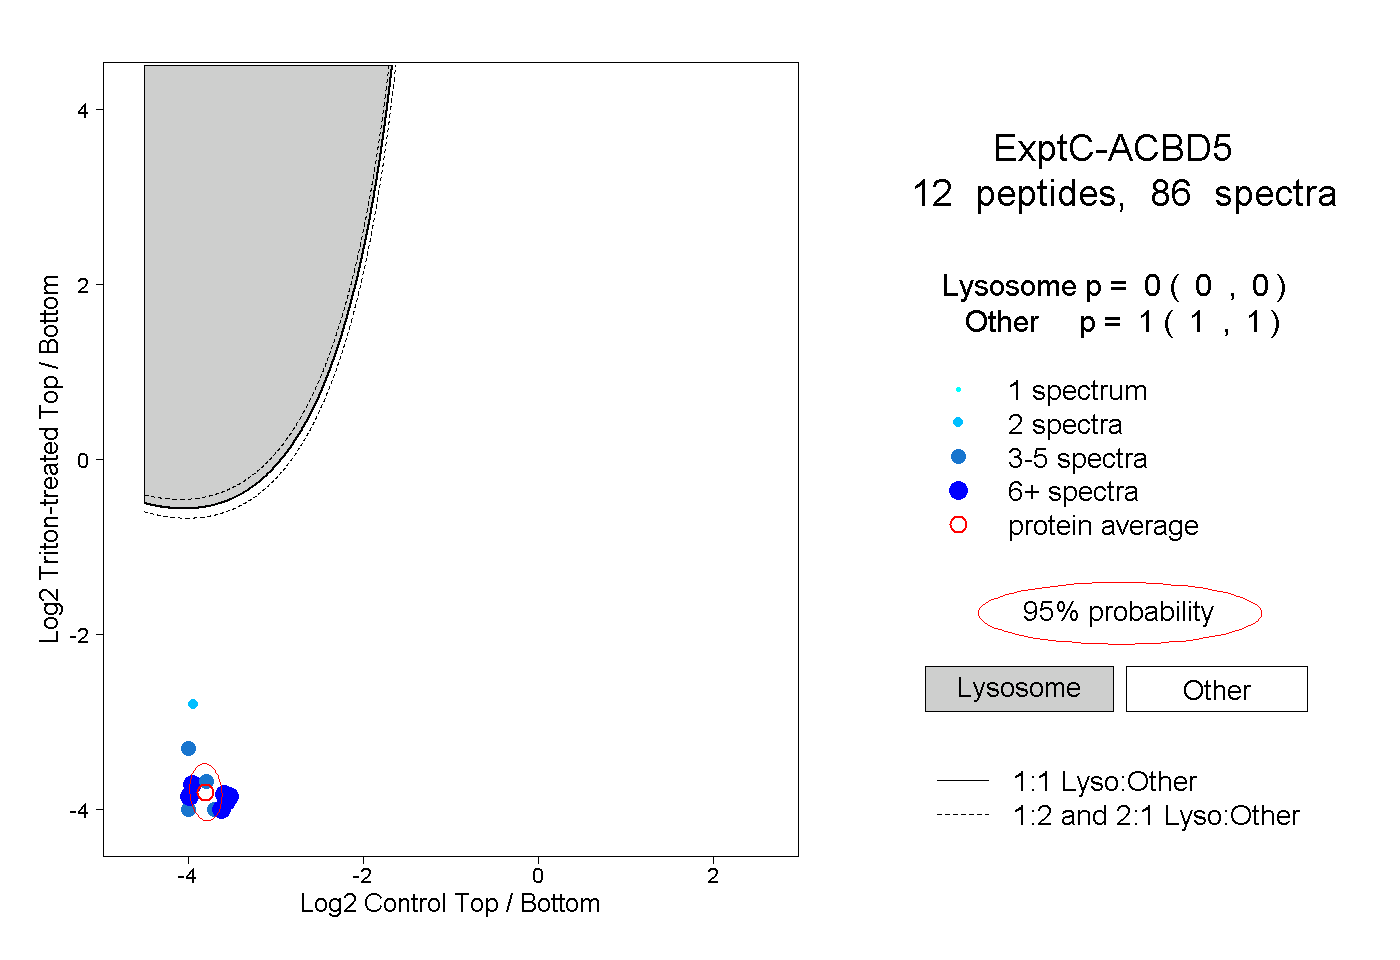 |
0.000 0.000 | 0.000 |
1.000 1.000 | 1.000 |
||||||||
| Plot | Lyso | Other | |||||||||||
| Expt D |
3 peptides |
4 spectra |
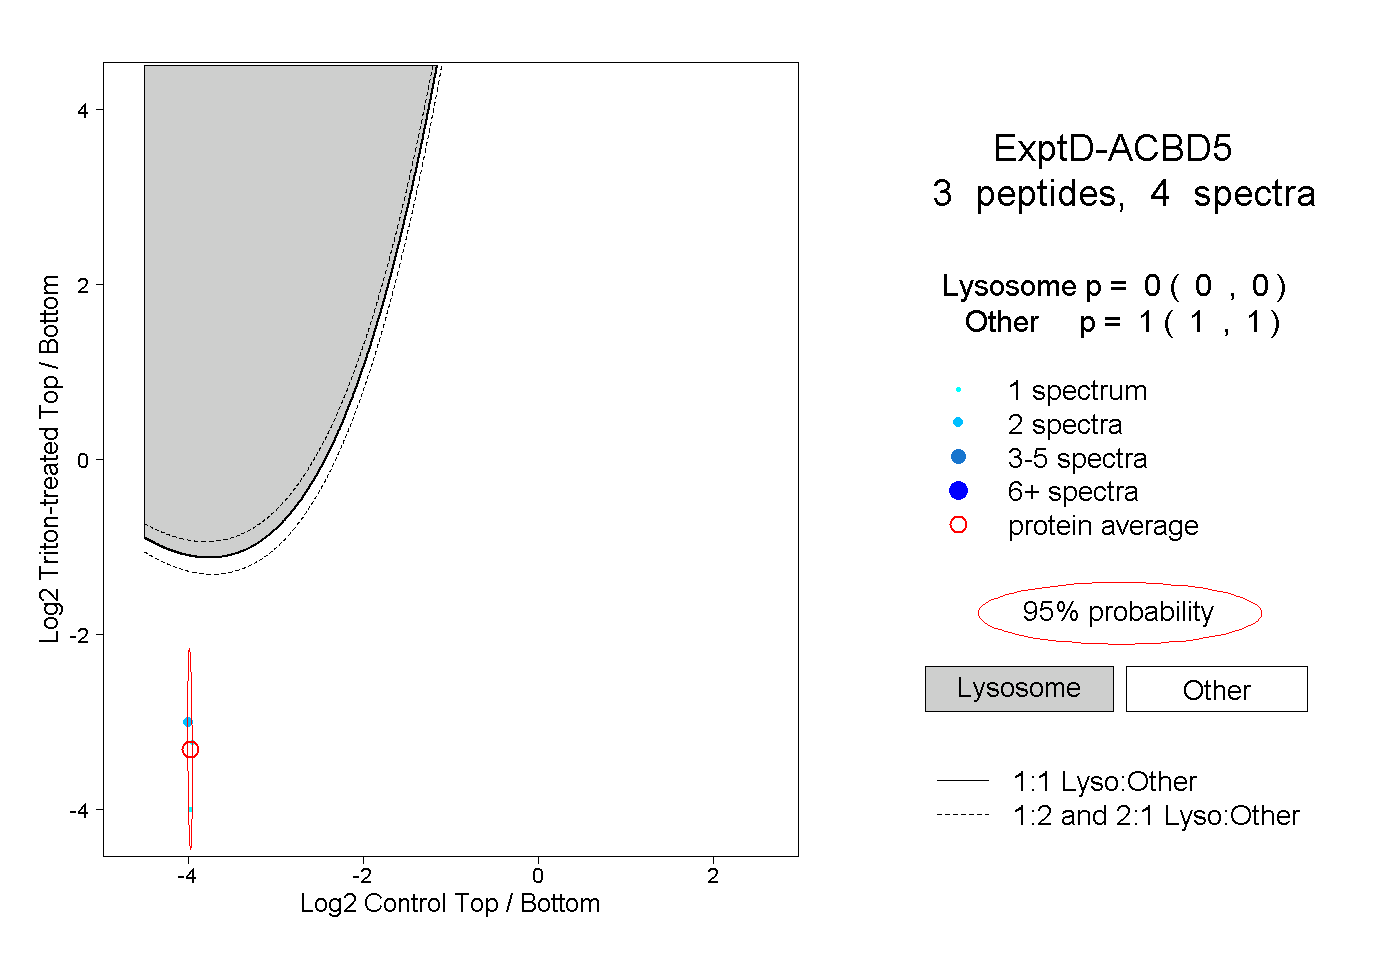 |
0.000 0.000 | 0.000 |
1.000 1.000 | 1.000 |