 10
10peptides
spectra

0.050 | 0.074
0.000 | 0.000
0.452 | 0.510
0.280 | 0.353
0.060 | 0.145
0.000 | 0.059
0.000 | 0.000
0.000 | 0.000
9peptides
spectra
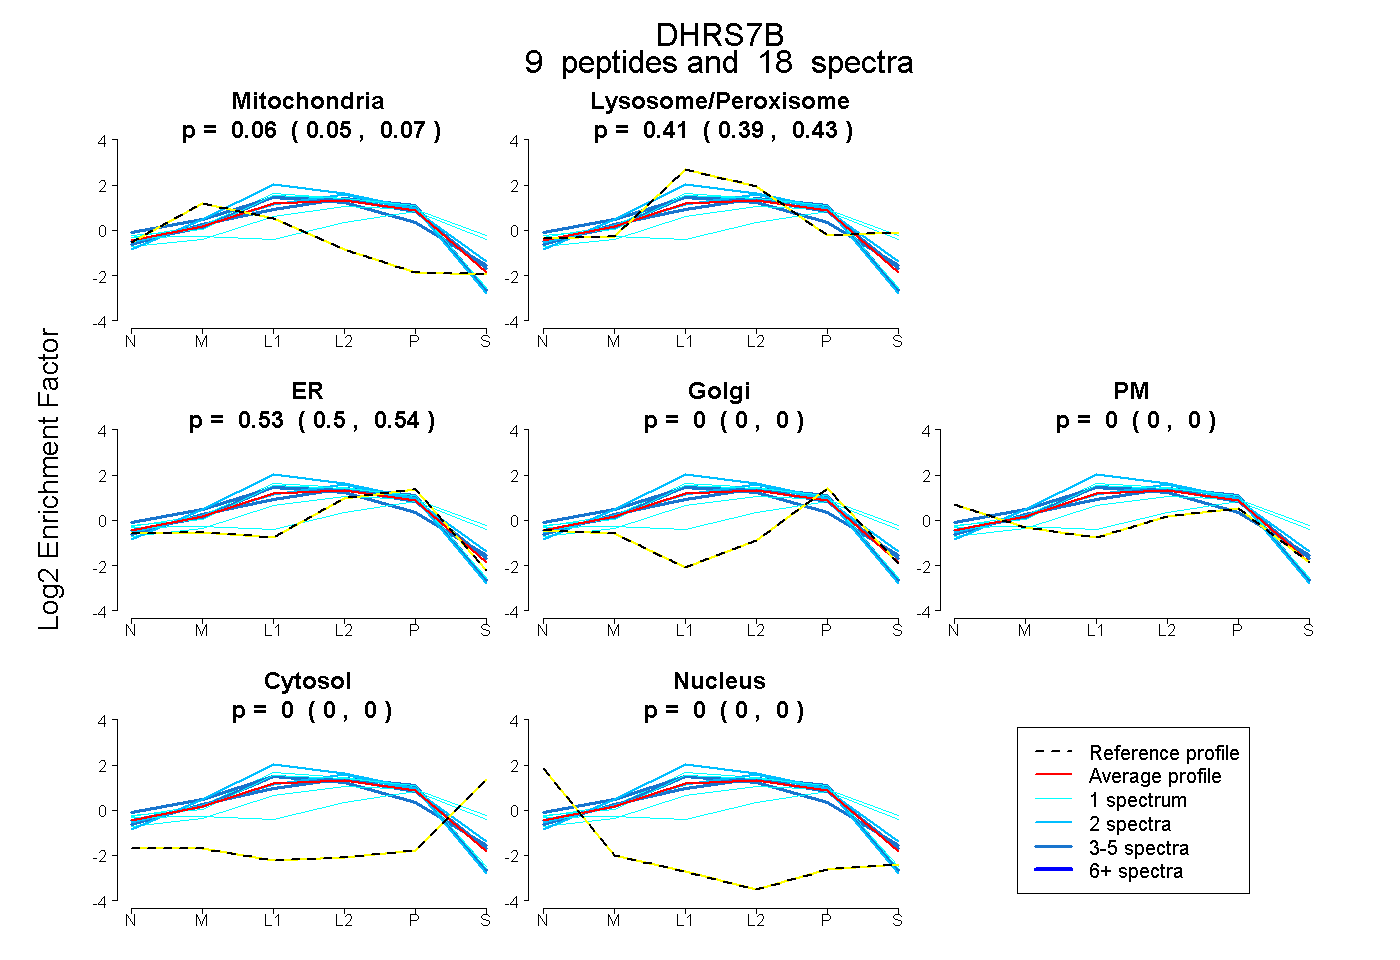
0.050 | 0.072
0.387 | 0.433
0.505 | 0.544
0.000 | 0.000
0.000 | 0.000
0.000 | 0.000
0.000 | 0.000
14peptides
spectra
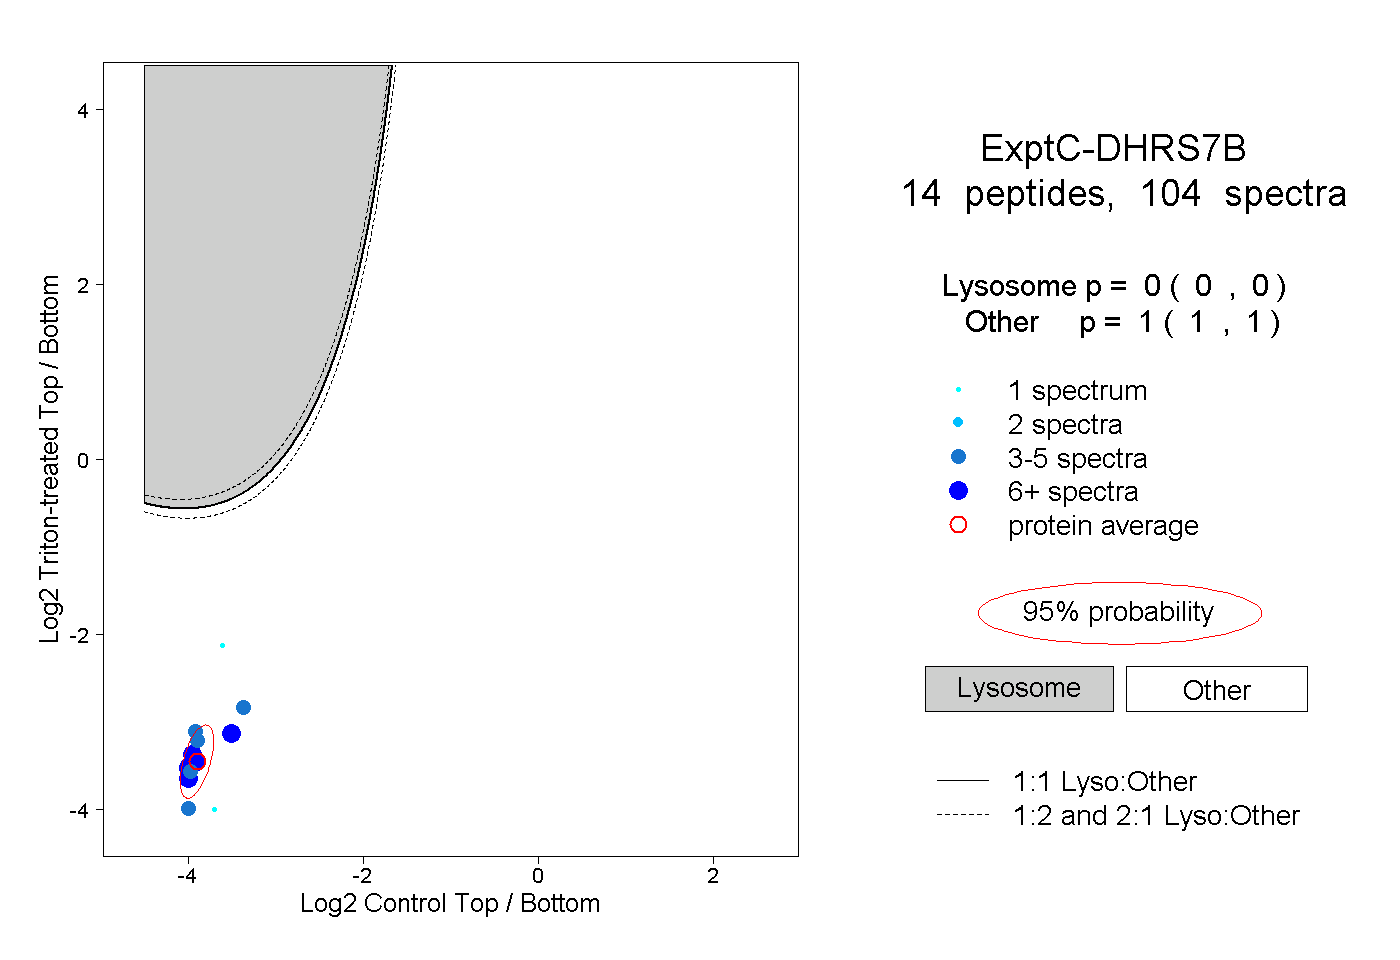
0.000 | 0.000
1.000 | 1.000
6peptides
spectra
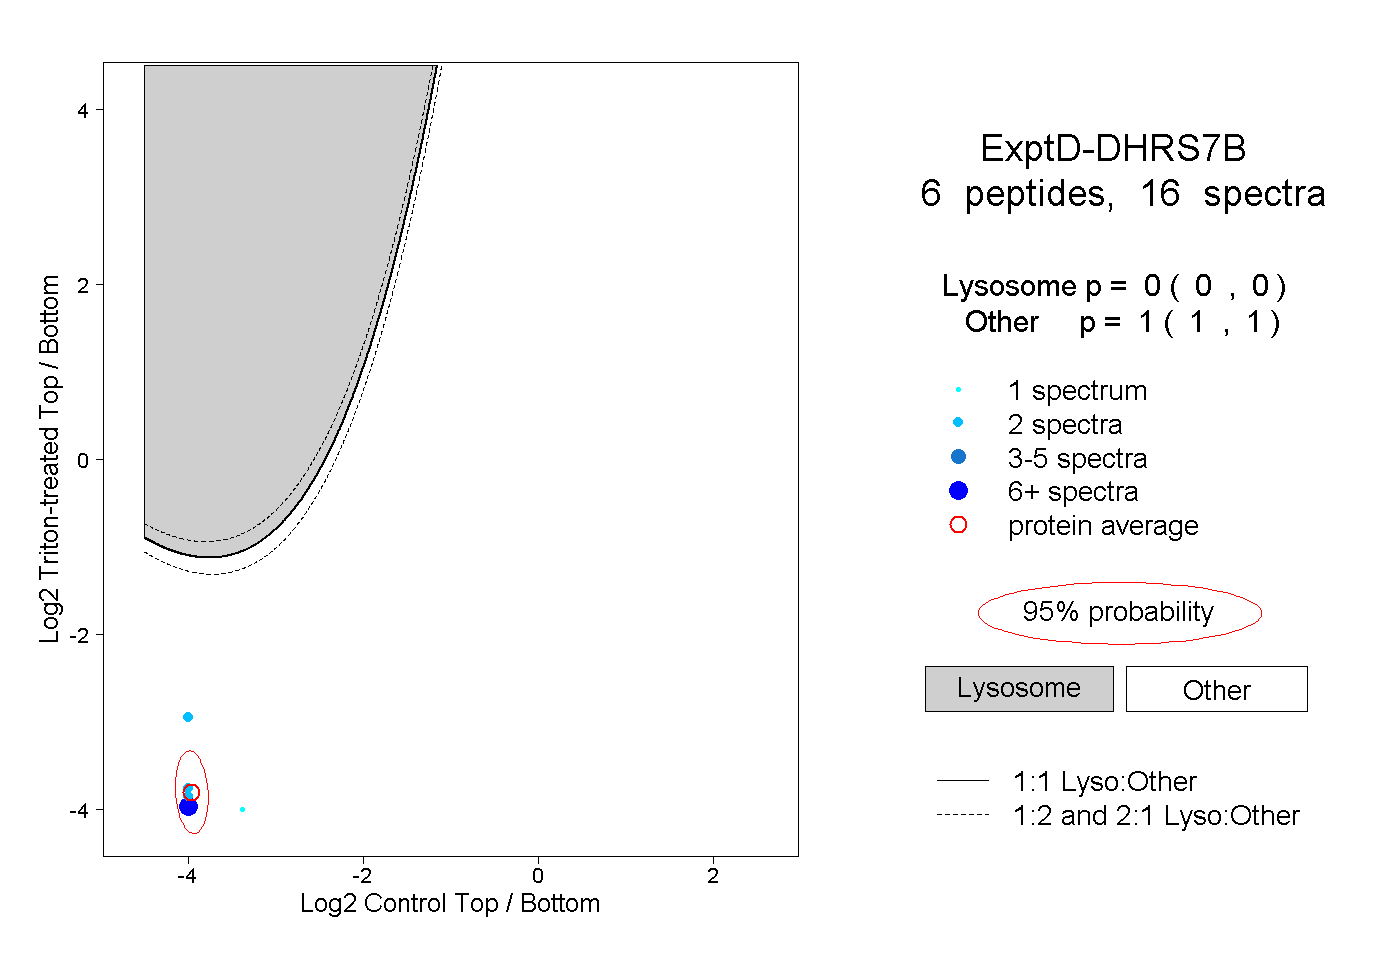
0.000 | 0.000
1.000 | 1.000