 10
10peptides
spectra

0.050 | 0.074
0.000 | 0.000
0.452 | 0.510
0.280 | 0.353
0.060 | 0.145
0.000 | 0.059
0.000 | 0.000
0.000 | 0.000
| Plot | Mito | Lyso | Perox | ER | Golgi | PM | Cytosol | Nucleus | |||||
| Expt A |
10 peptides |
26 spectra |
|
0.063 0.050 | 0.074 |
0.000 0.000 | 0.000 |
0.486 0.452 | 0.510 |
0.319 0.280 | 0.353 |
0.110 0.060 | 0.145 |
0.020 0.000 | 0.059 |
0.000 0.000 | 0.000 |
0.000 0.000 | 0.000 |
| 2 spectra, VFHAAGAK | 0.224 | 0.000 | 0.233 | 0.421 | 0.000 | 0.118 | 0.000 | 0.003 | ||
| 4 spectra, ISIPFR | 0.012 | 0.174 | 0.354 | 0.330 | 0.000 | 0.130 | 0.000 | 0.000 | ||
| 4 spectra, GAISDTIVDVDR | 0.000 | 0.021 | 0.531 | 0.360 | 0.000 | 0.089 | 0.000 | 0.000 | ||
| 1 spectrum, SAVEVAQDIFDAVGK | 0.000 | 0.025 | 0.209 | 0.407 | 0.000 | 0.359 | 0.000 | 0.000 | ||
| 3 spectra, VVLCGR | 0.162 | 0.000 | 0.331 | 0.507 | 0.000 | 0.000 | 0.000 | 0.000 | ||
| 1 spectrum, NAVVVVTGATSGLGK | 0.085 | 0.000 | 0.419 | 0.360 | 0.012 | 0.000 | 0.123 | 0.000 | ||
| 2 spectra, HATQAFFDCLR | 0.000 | 0.000 | 0.607 | 0.000 | 0.314 | 0.000 | 0.079 | 0.000 | ||
| 2 spectra, SAYAASK | 0.007 | 0.000 | 0.506 | 0.000 | 0.194 | 0.000 | 0.292 | 0.000 | ||
| 2 spectra, YGALDK | 0.000 | 0.000 | 0.482 | 0.195 | 0.039 | 0.000 | 0.284 | 0.000 | ||
| 5 spectra, ALLPSMVER | 0.012 | 0.000 | 0.481 | 0.373 | 0.000 | 0.134 | 0.000 | 0.000 |
| Plot | Mito | Lyso or Perox | ER | Golgi | PM | Cytosol | Nucleus | ||||||
| Expt B |
9 peptides |
18 spectra |
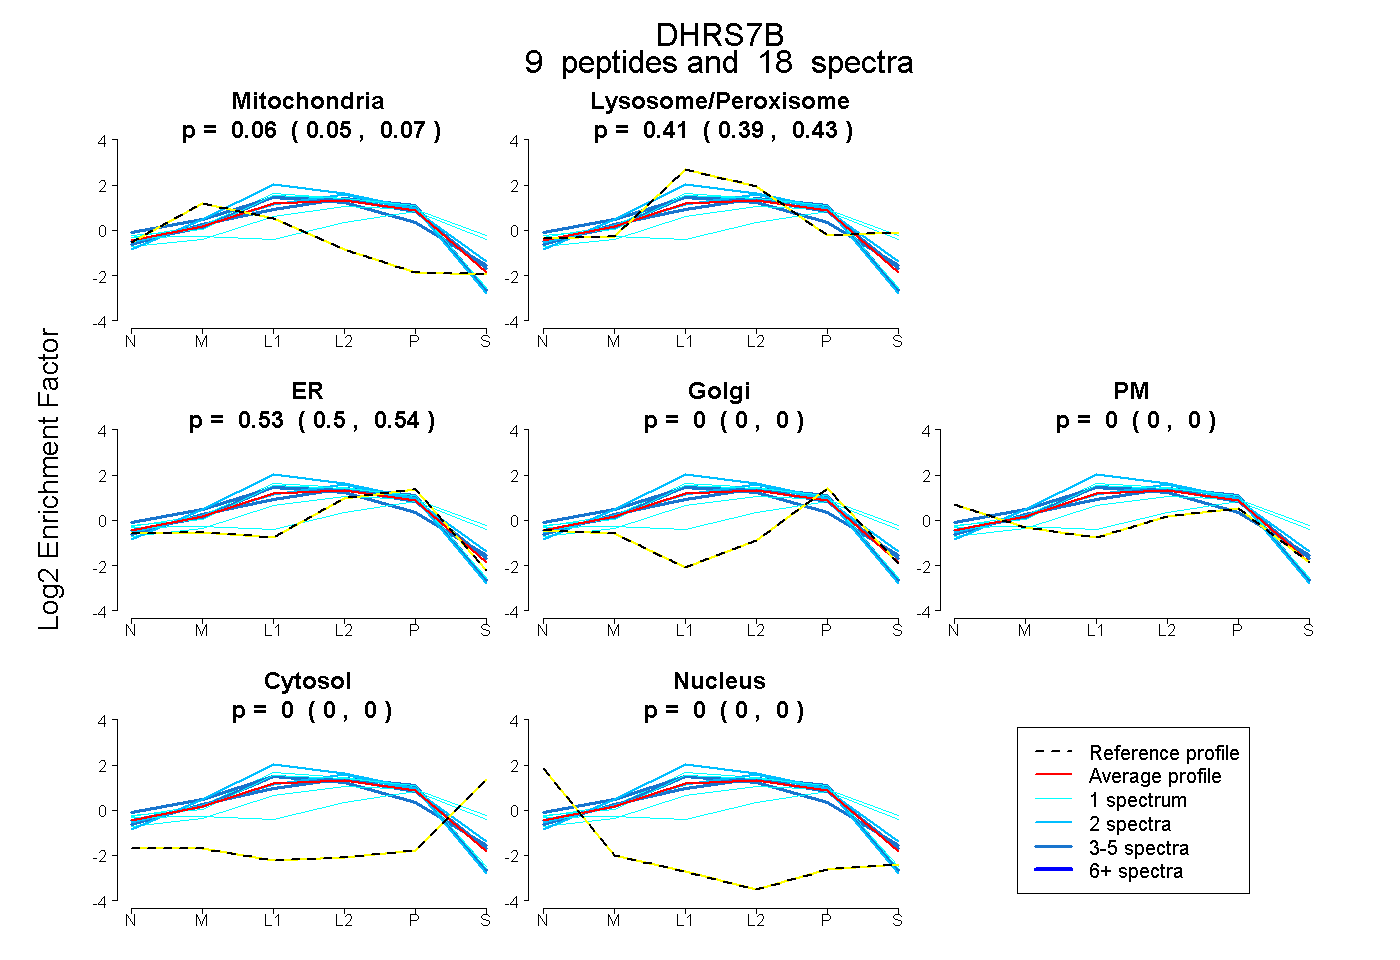 |
0.062 0.050 | 0.072 |
0.412 0.387 | 0.433 |
0.526 0.505 | 0.544 |
0.000 0.000 | 0.000 |
0.000 0.000 | 0.000 |
0.000 0.000 | 0.000 |
0.000 0.000 | 0.000 |
|||
| Plot | Lyso | Other | |||||||||||
| Expt C |
14 peptides |
104 spectra |
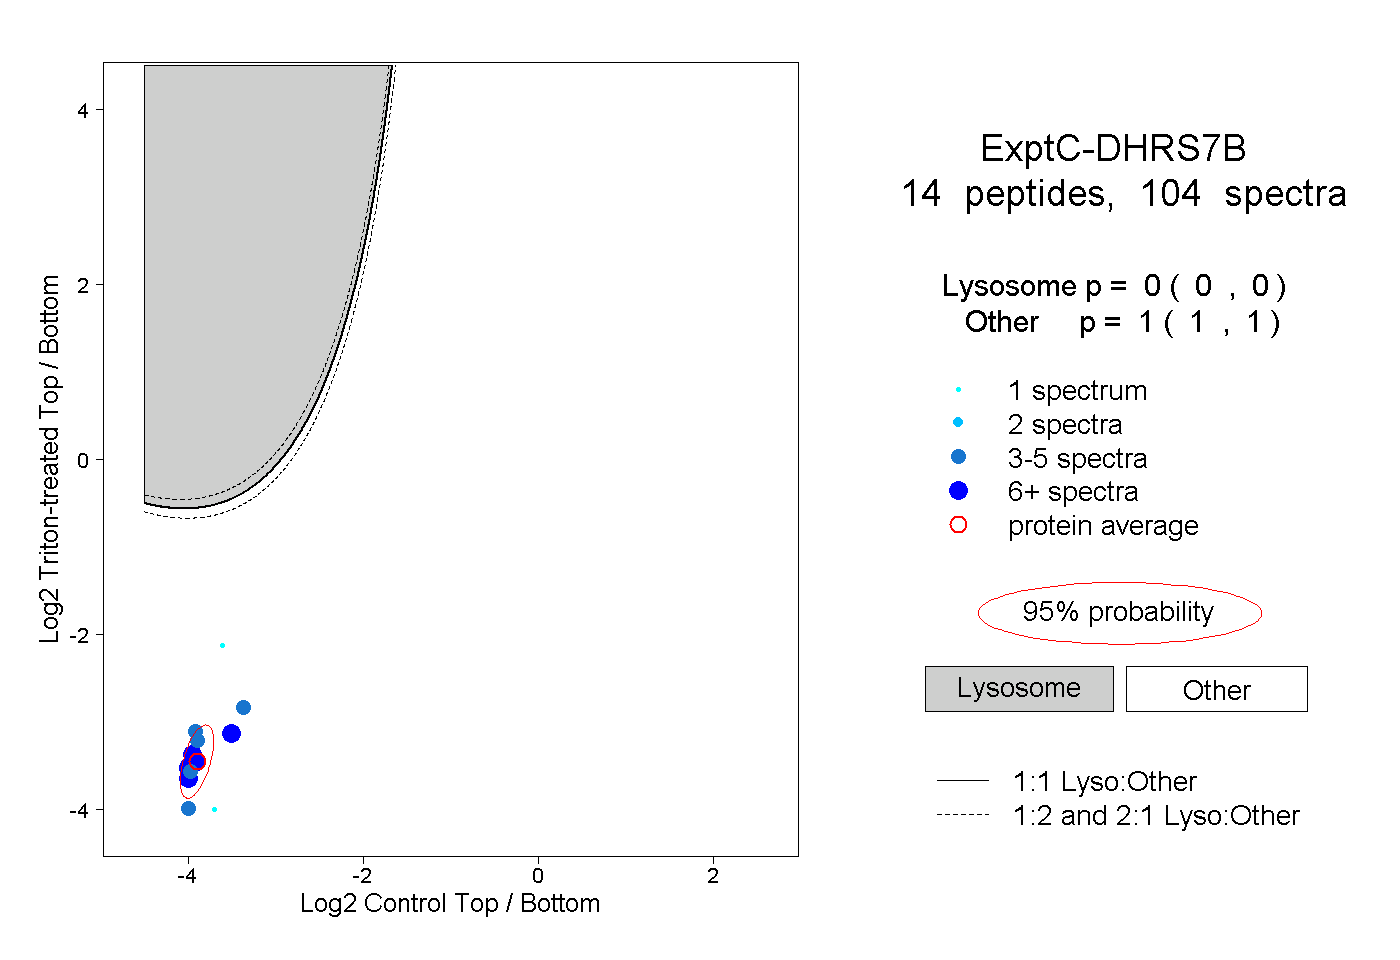 |
0.000 0.000 | 0.000 |
1.000 1.000 | 1.000 |
||||||||
| Plot | Lyso | Other | |||||||||||
| Expt D |
6 peptides |
16 spectra |
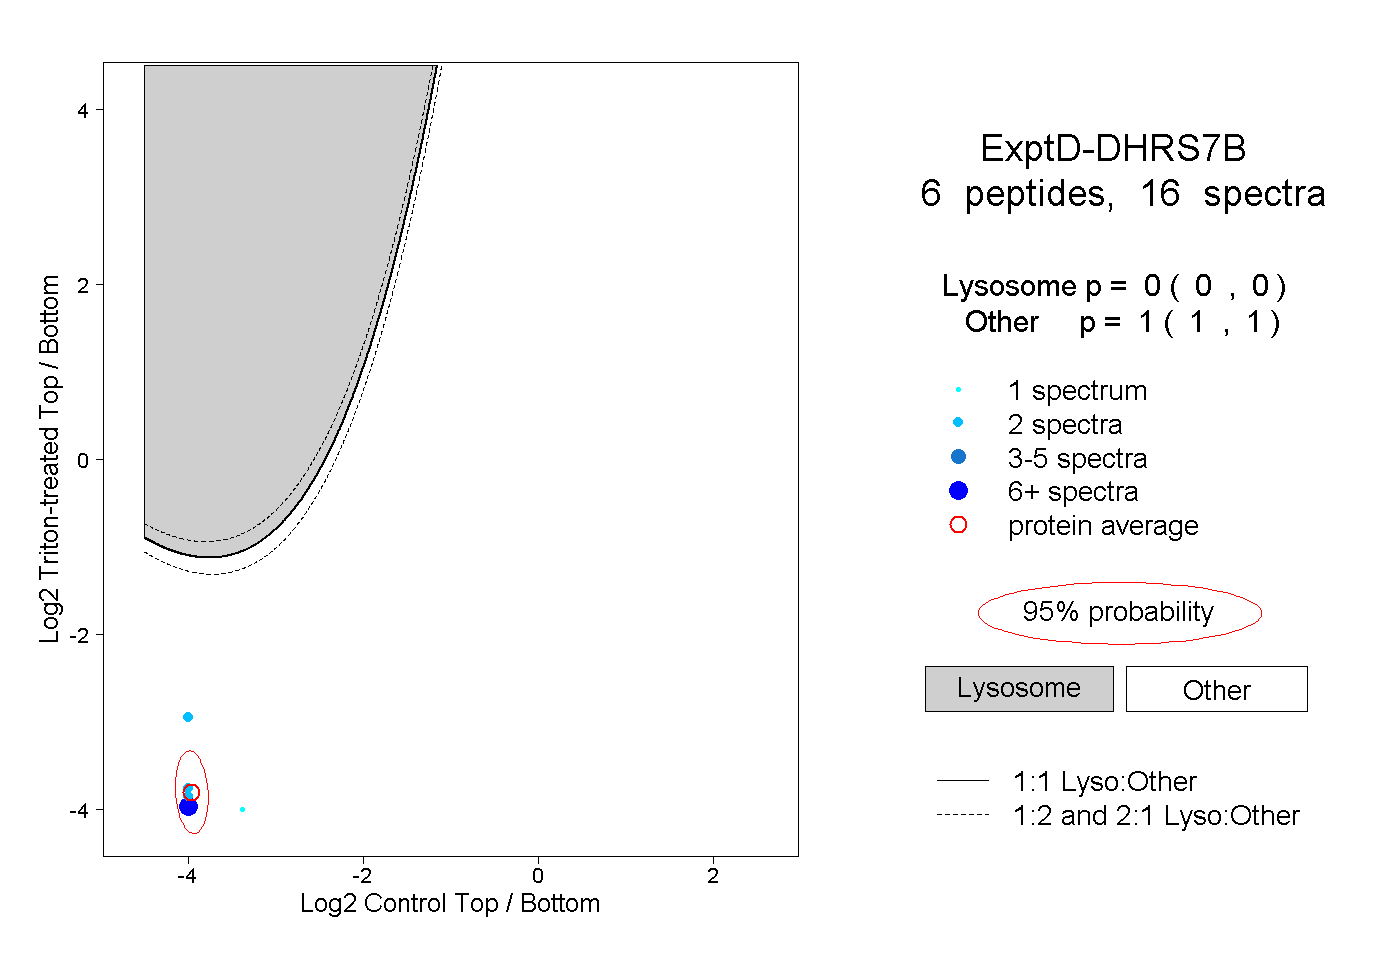 |
0.000 0.000 | 0.000 |
1.000 1.000 | 1.000 |