 4
4peptides
spectra
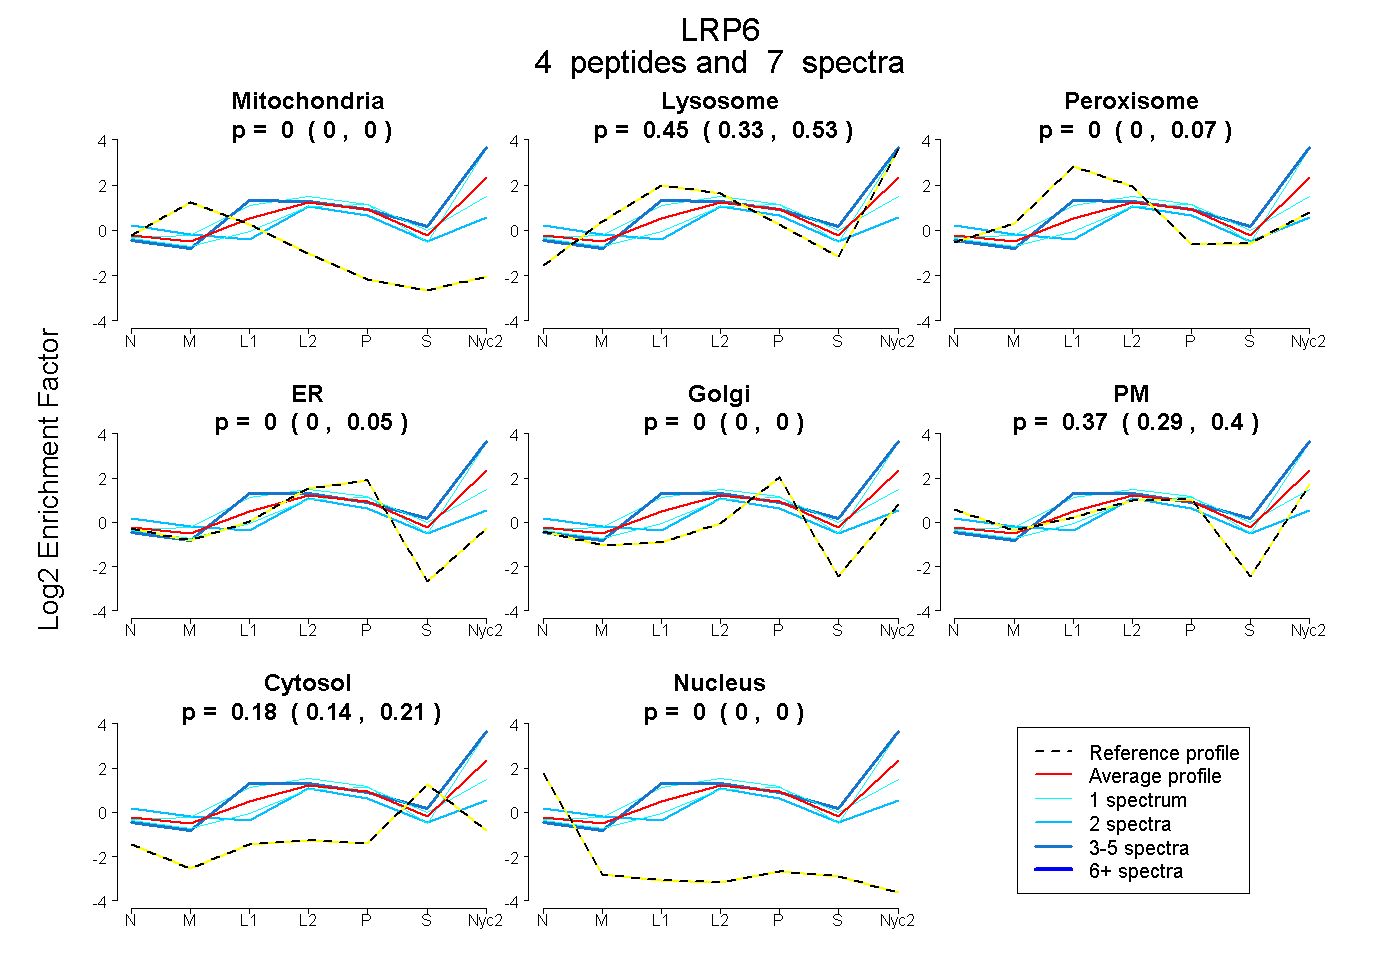
0.000 | 0.000
0.328 | 0.527
0.000 | 0.074
0.000 | 0.051
0.000 | 0.004
0.292 | 0.403
0.140 | 0.208
0.000 | 0.000
1peptide
spectrum
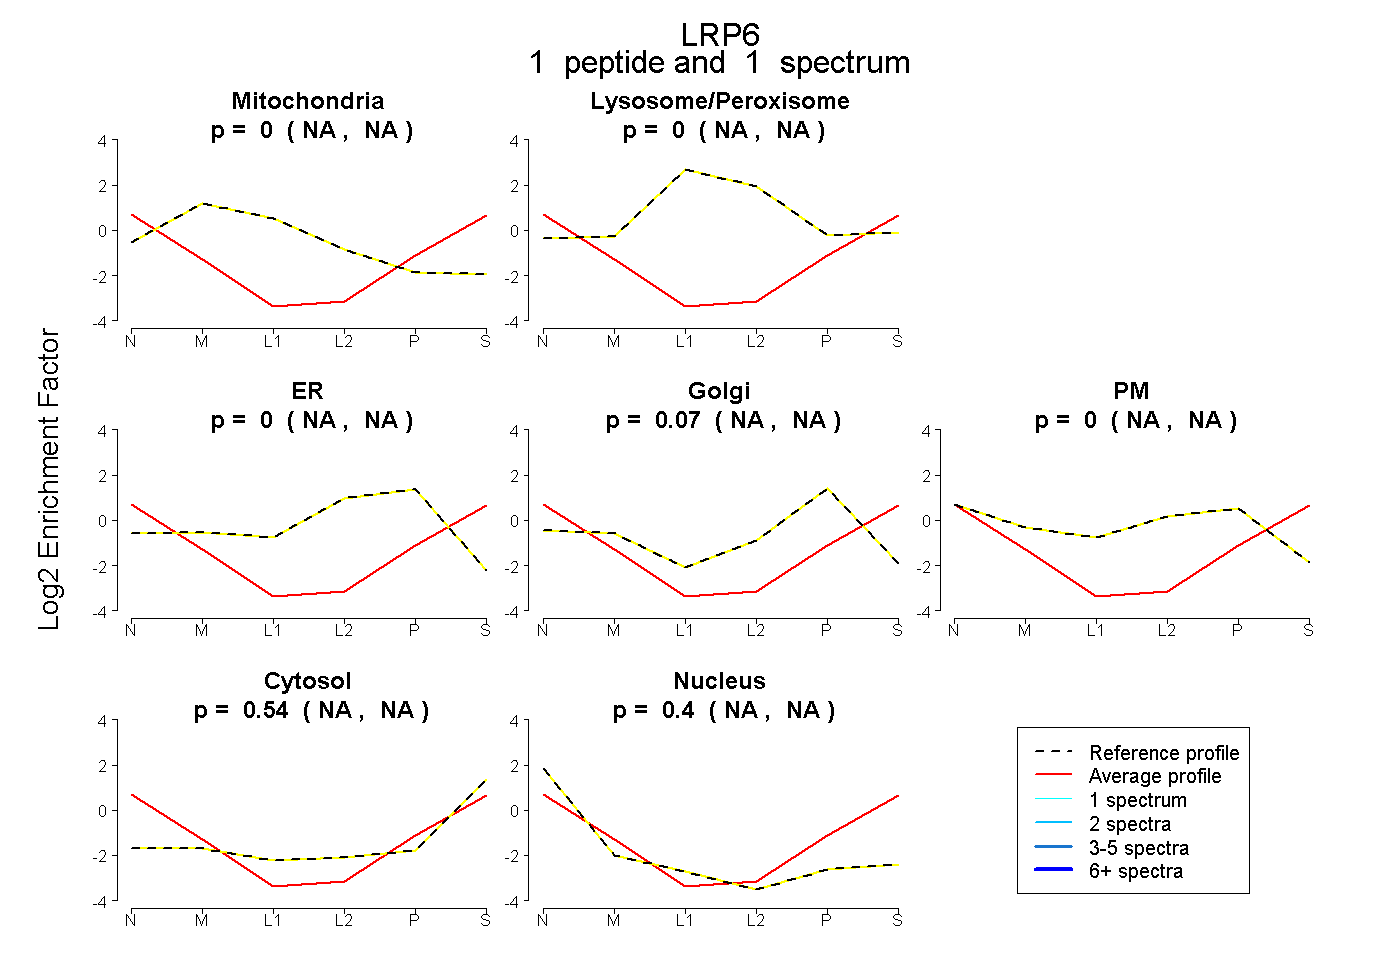
NA | NA
NA | NA
NA | NA
NA | NA
NA | NA
NA | NA
NA | NA
6peptides
spectra
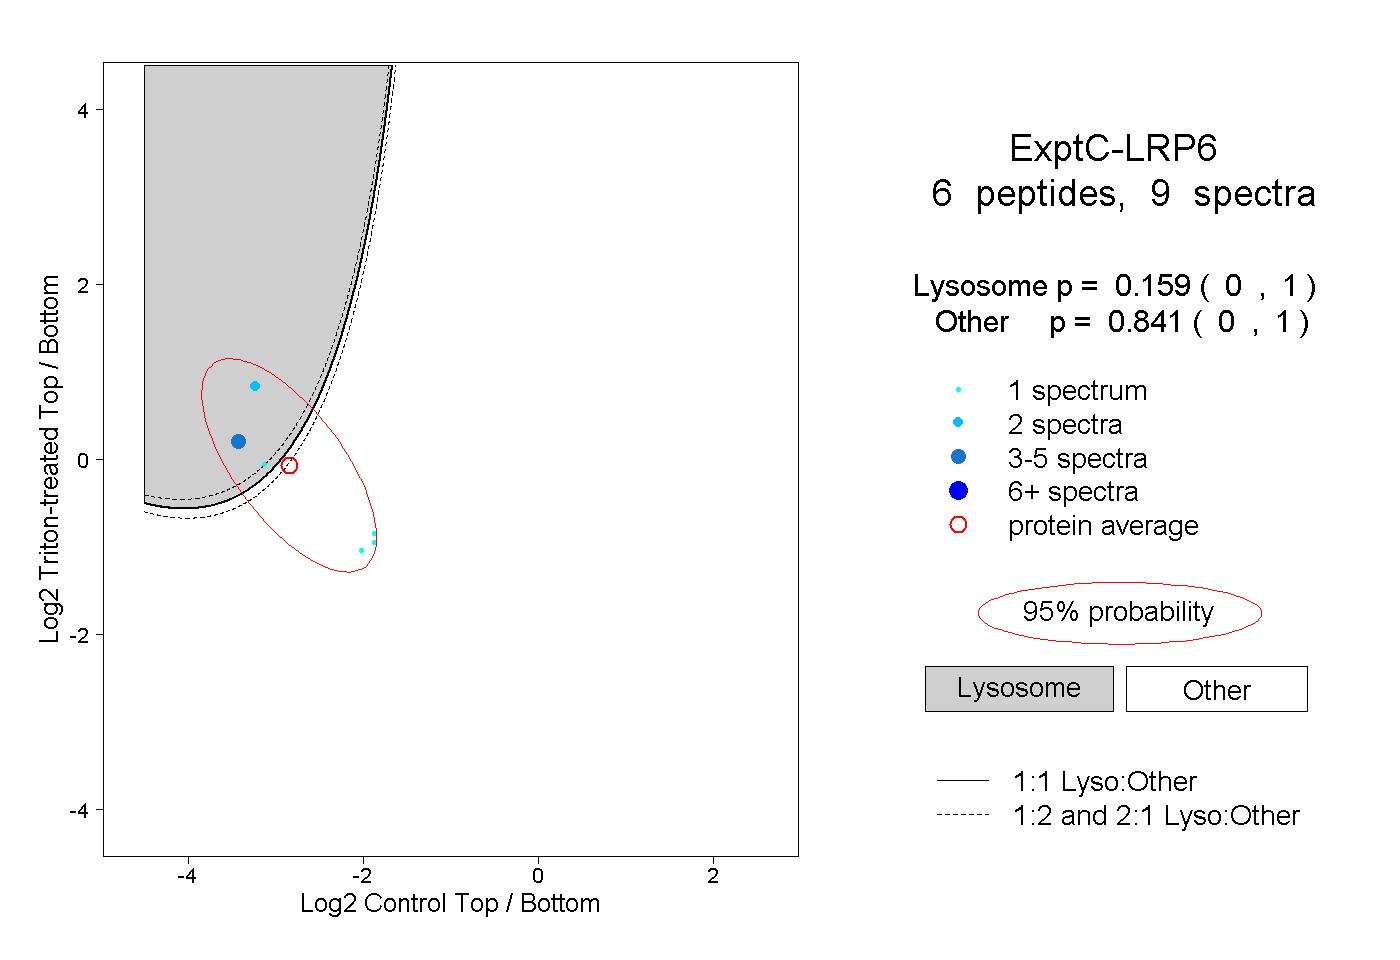
0.000 | 1.000
0.000 | 1.000