LRP6
[ENSRNOP00000063261]
Main page
| | | Plot |
Mito |
Lyso |
|
Perox |
ER |
Golgi |
PM |
Cytosol |
Nucleus |
|
| Expt A |
 4
4
peptides |
7
spectra |
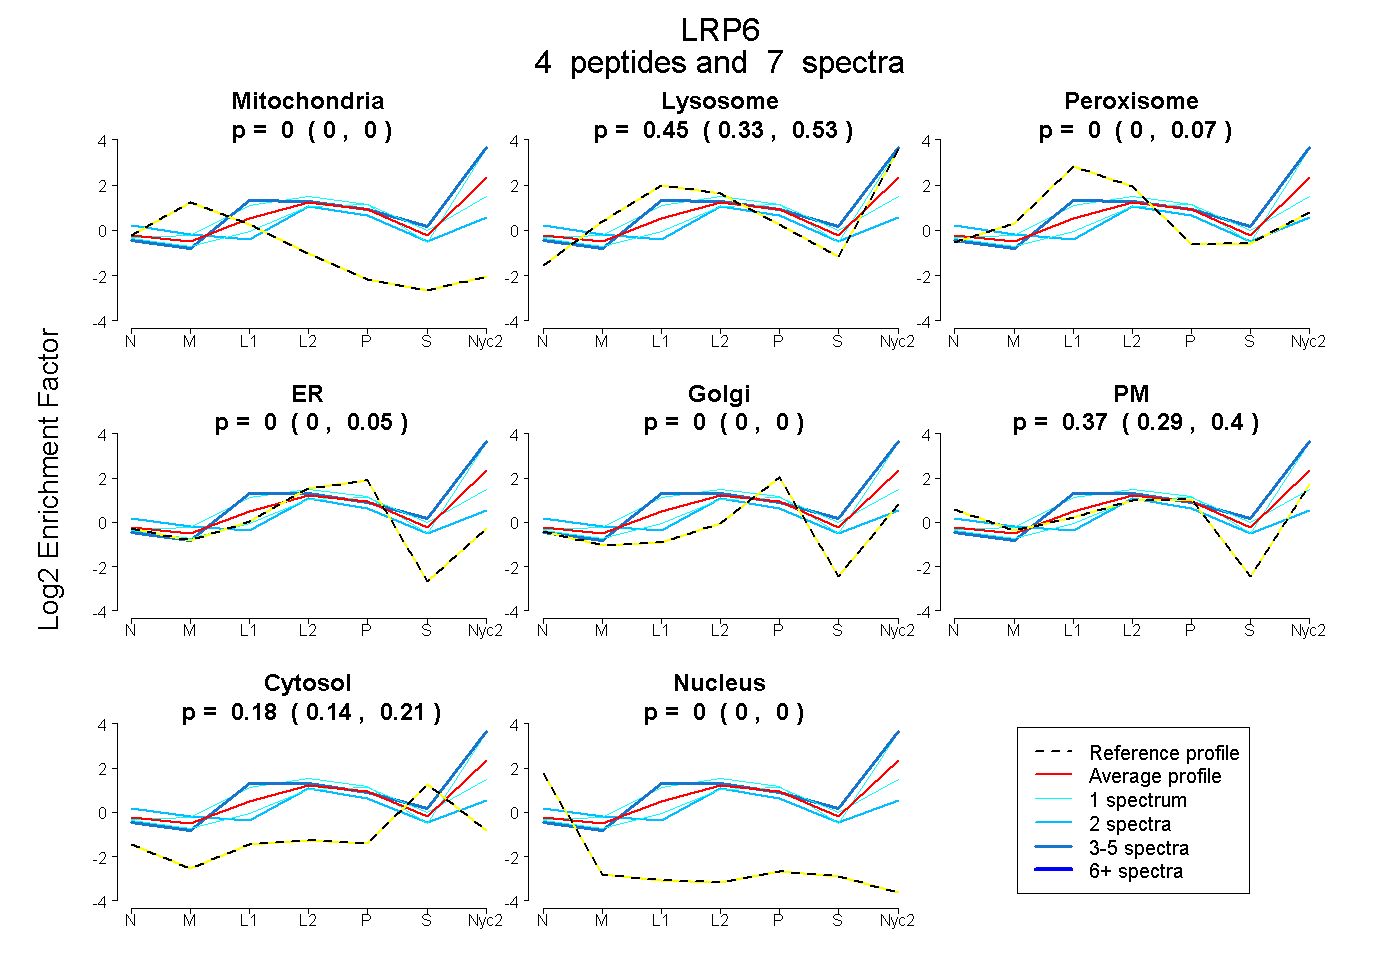 |
0.000
0.000 | 0.000 |
0.451
0.328 | 0.527 |
|
0.000
0.000 | 0.074 |
0.000
0.000 | 0.051 |
0.000
0.000 | 0.004 |
0.367
0.292 | 0.403 |
0.182
0.140 | 0.208 |
0.000
0.000 | 0.000 |
|
| | | Plot |
Mito |
|
Lyso or Perox |
|
ER |
Golgi |
PM |
Cytosol |
Nucleus |
|
| Expt B |
1
peptide |
1
spectrum |
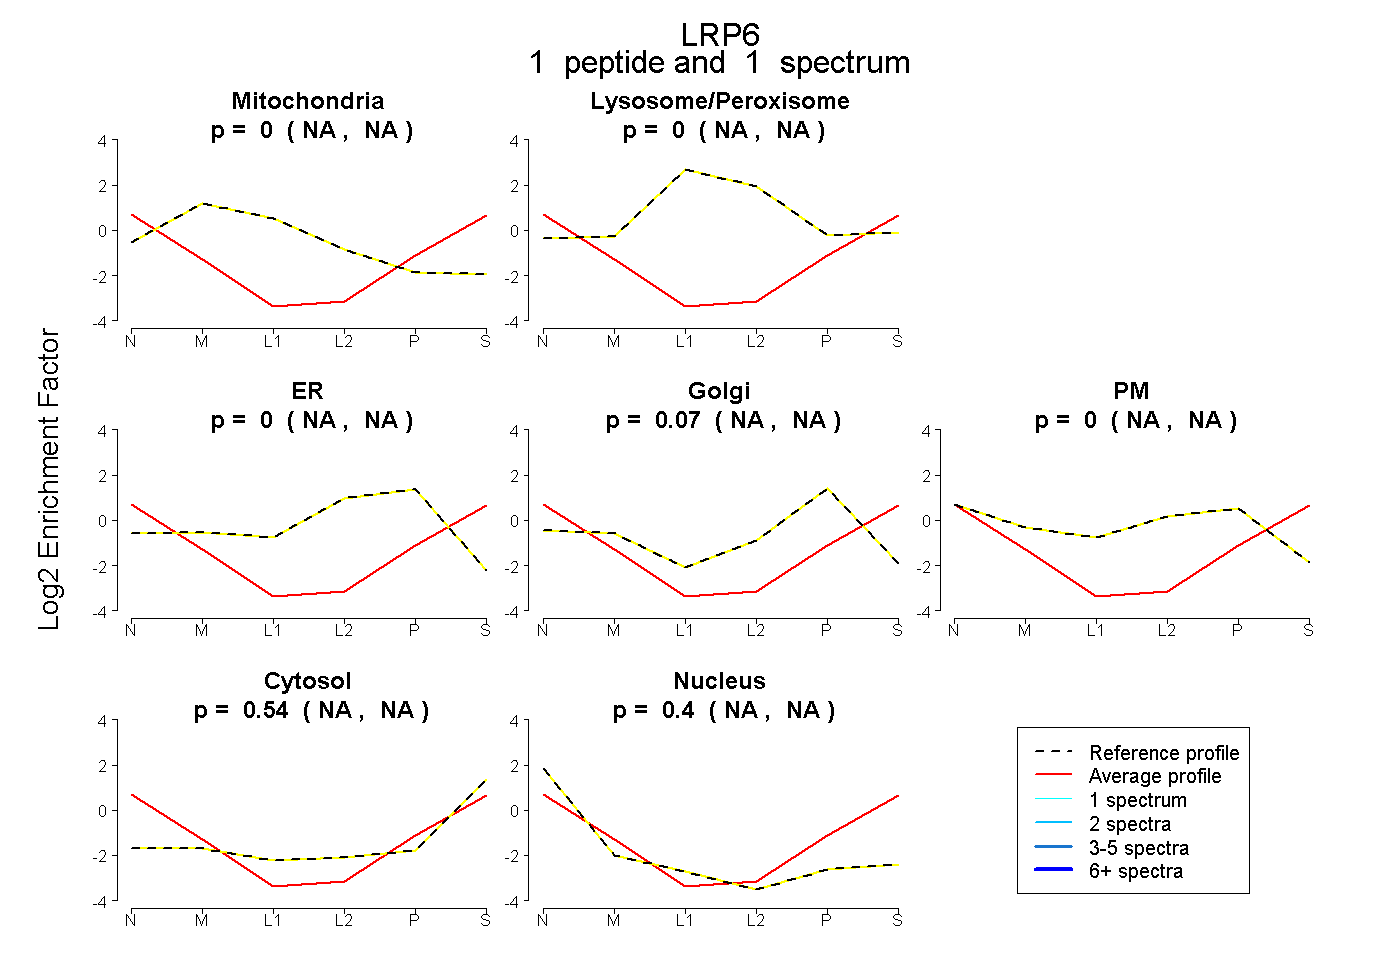 |
0.000
NA | NA |
|
0.000
NA | NA |
|
0.000
NA | NA |
0.067
NA | NA |
0.000
NA | NA |
0.536
NA | NA |
0.397
NA | NA |
|
| | | Plot |
|
Lyso |
|
|
|
|
|
|
|
Other |
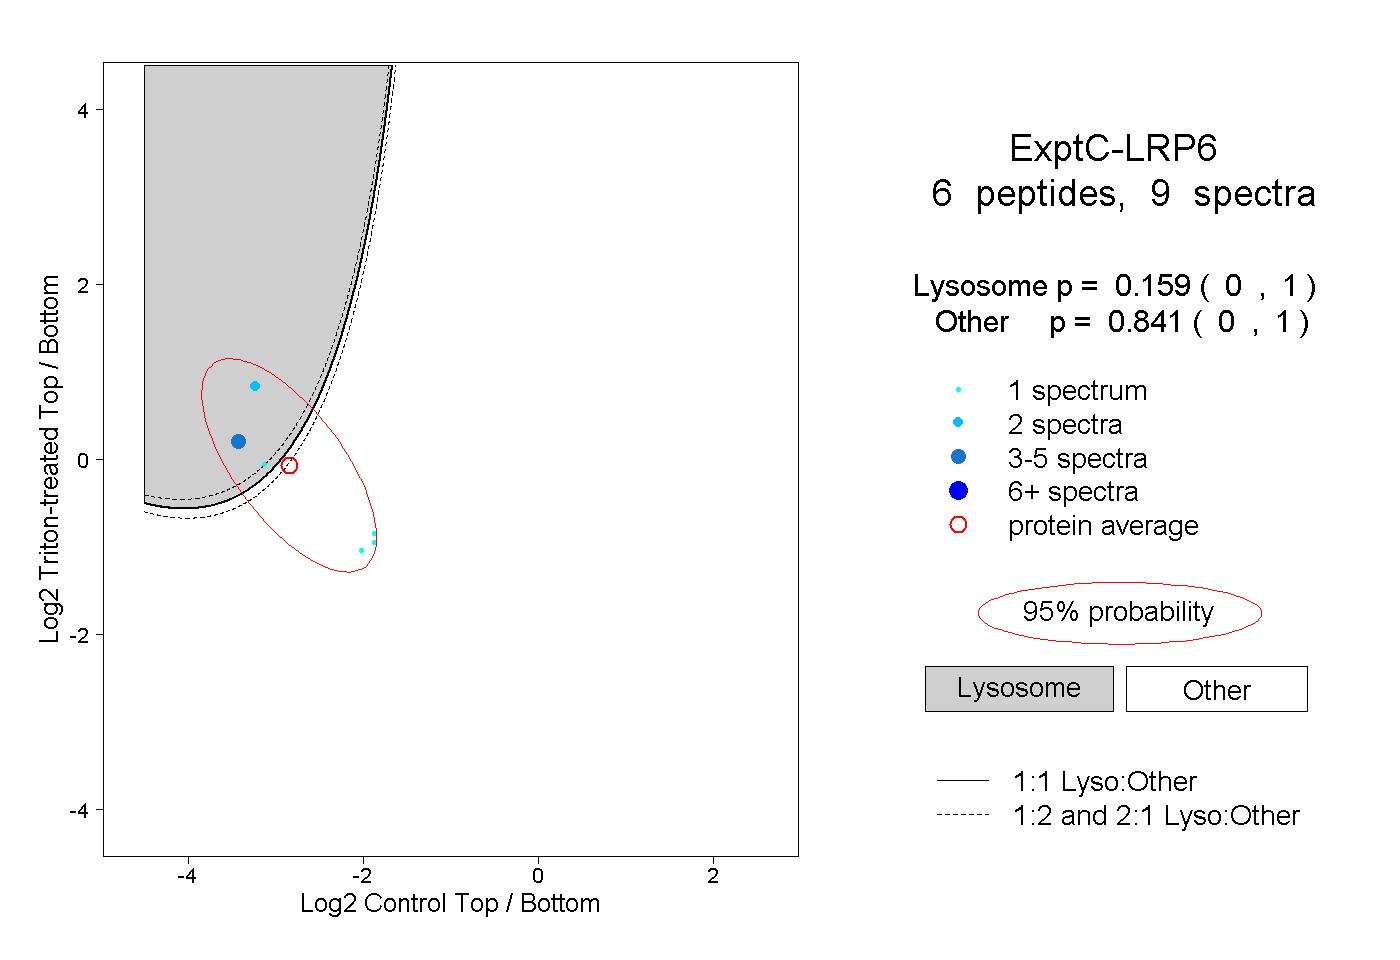
| Expt C |
6
peptides |
9
spectra |
 |
|
0.159
0.000 | 1.000 |
|
|
|
|
|
|
|
0.841
0.000 | 1.000 |
| 3 spectra, SNLDGTNR |
|
0.999 |
|
|
|
|
|
|
|
0.001 |
| 2 spectra, YTGEGLR |
|
1.000 |
|
|
|
|
|
|
|
0.000 |
| 1 spectrum, DGATELLLLAR |
|
0.000 |
|
|
|
|
|
|
|
1.000 |
| 1 spectrum, AIVVNPEK |
|
0.000 |
|
|
|
|
|
|
|
1.000 |
| 1 spectrum, LNFIHK |
|
0.796 |
|
|
|
|
|
|
|
0.204 |
| 1 spectrum, DLDSPR |
|
0.000 |
|
|
|
|
|
|
|
1.000 |