 20
20peptides
spectra
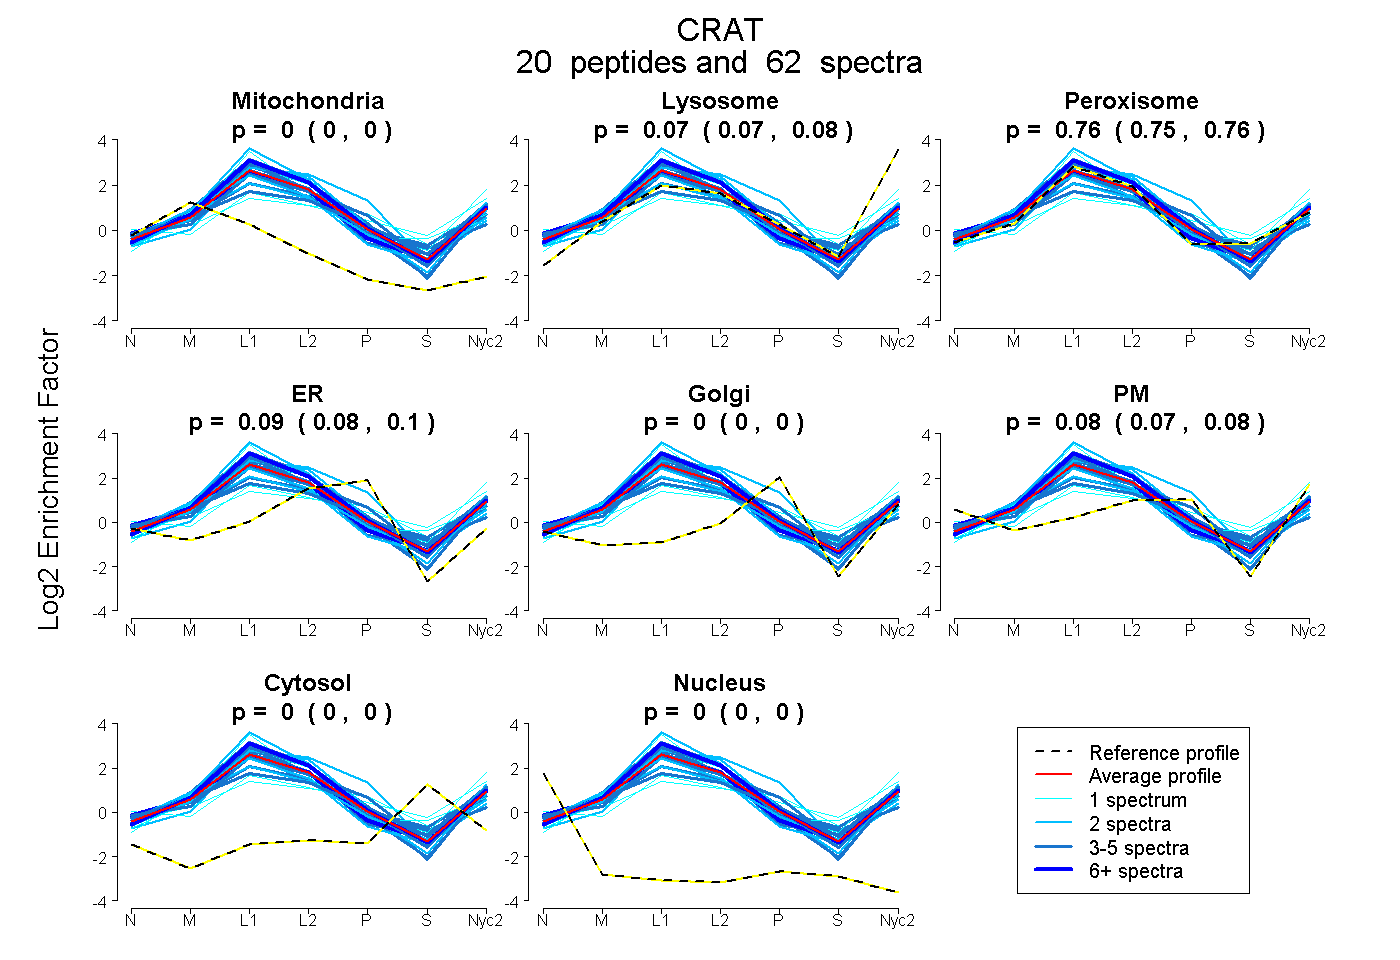
0.000 | 0.002
0.069 | 0.080
0.750 | 0.765
0.082 | 0.097
0.000 | 0.000
0.068 | 0.084
0.000 | 0.000
0.000 | 0.000
7peptides
spectra
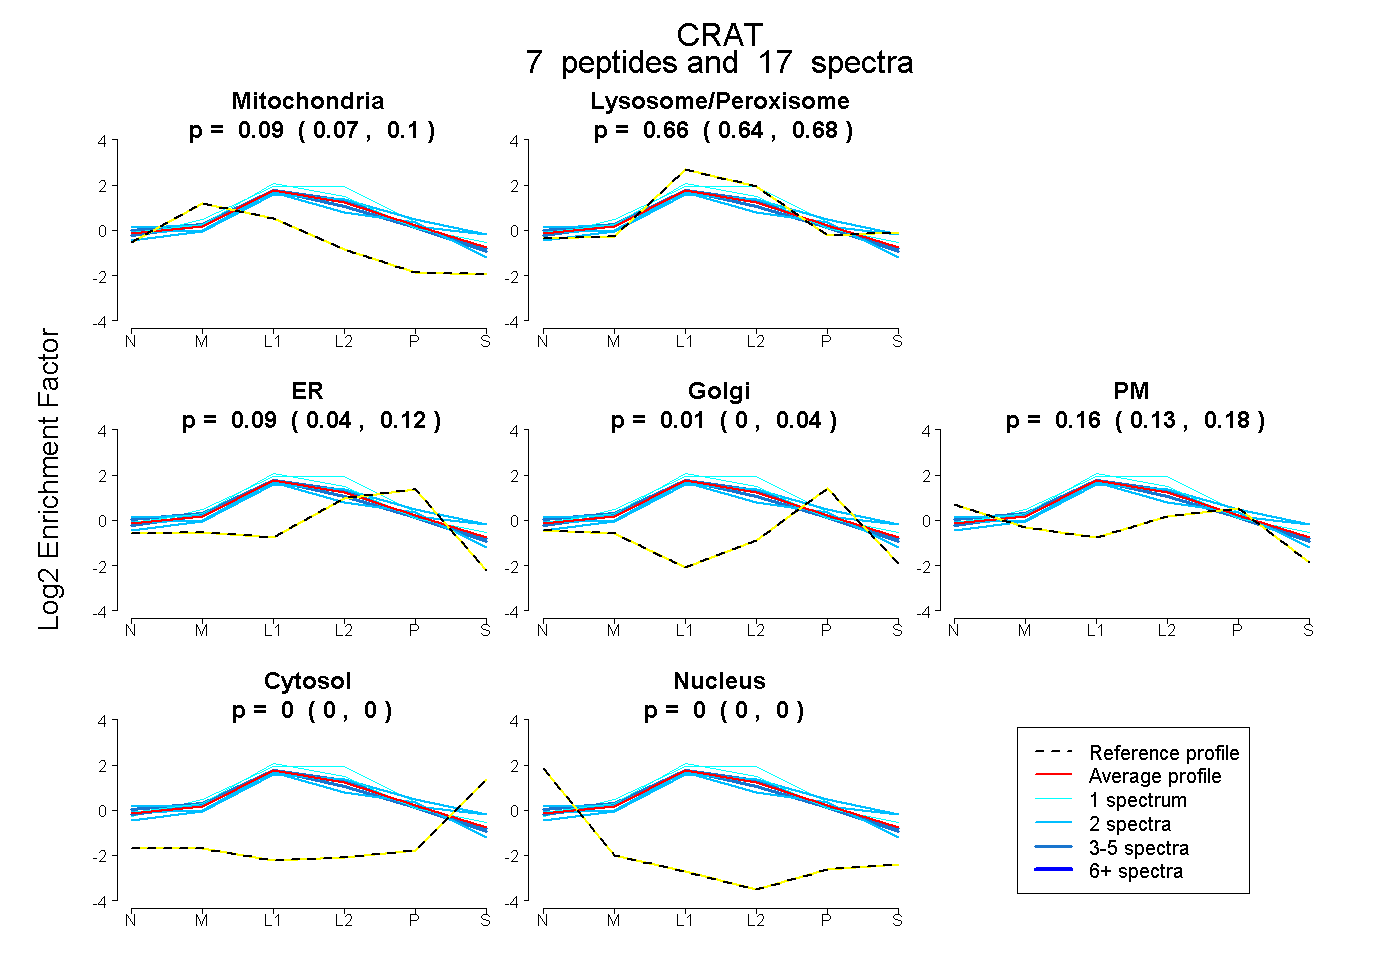
0.068 | 0.100
0.639 | 0.676
0.041 | 0.115
0.000 | 0.042
0.133 | 0.184
0.000 | 0.000
0.000 | 0.000
29peptides
spectra

0.000 | 0.000
1.000 | 1.000
13peptides
spectra
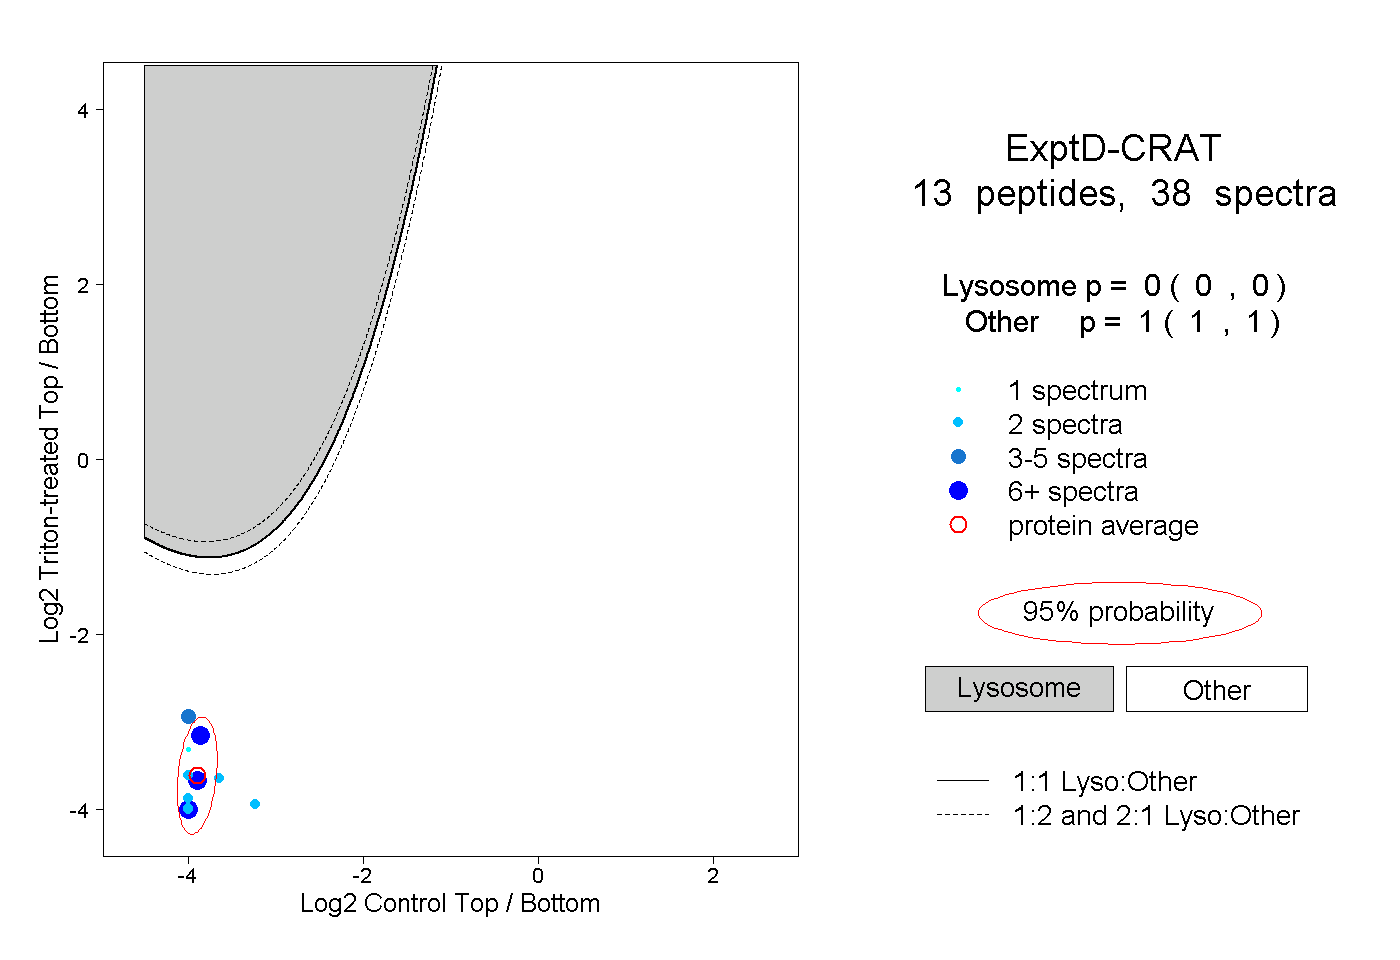
0.000 | 0.000
1.000 | 1.000