 20
20peptides
spectra
0.000 | 0.002
0.069 | 0.080
0.750 | 0.765
0.082 | 0.097
0.000 | 0.000
0.068 | 0.084
0.000 | 0.000
0.000 | 0.000
| Plot | Mito | Lyso | Perox | ER | Golgi | PM | Cytosol | Nucleus | |||||
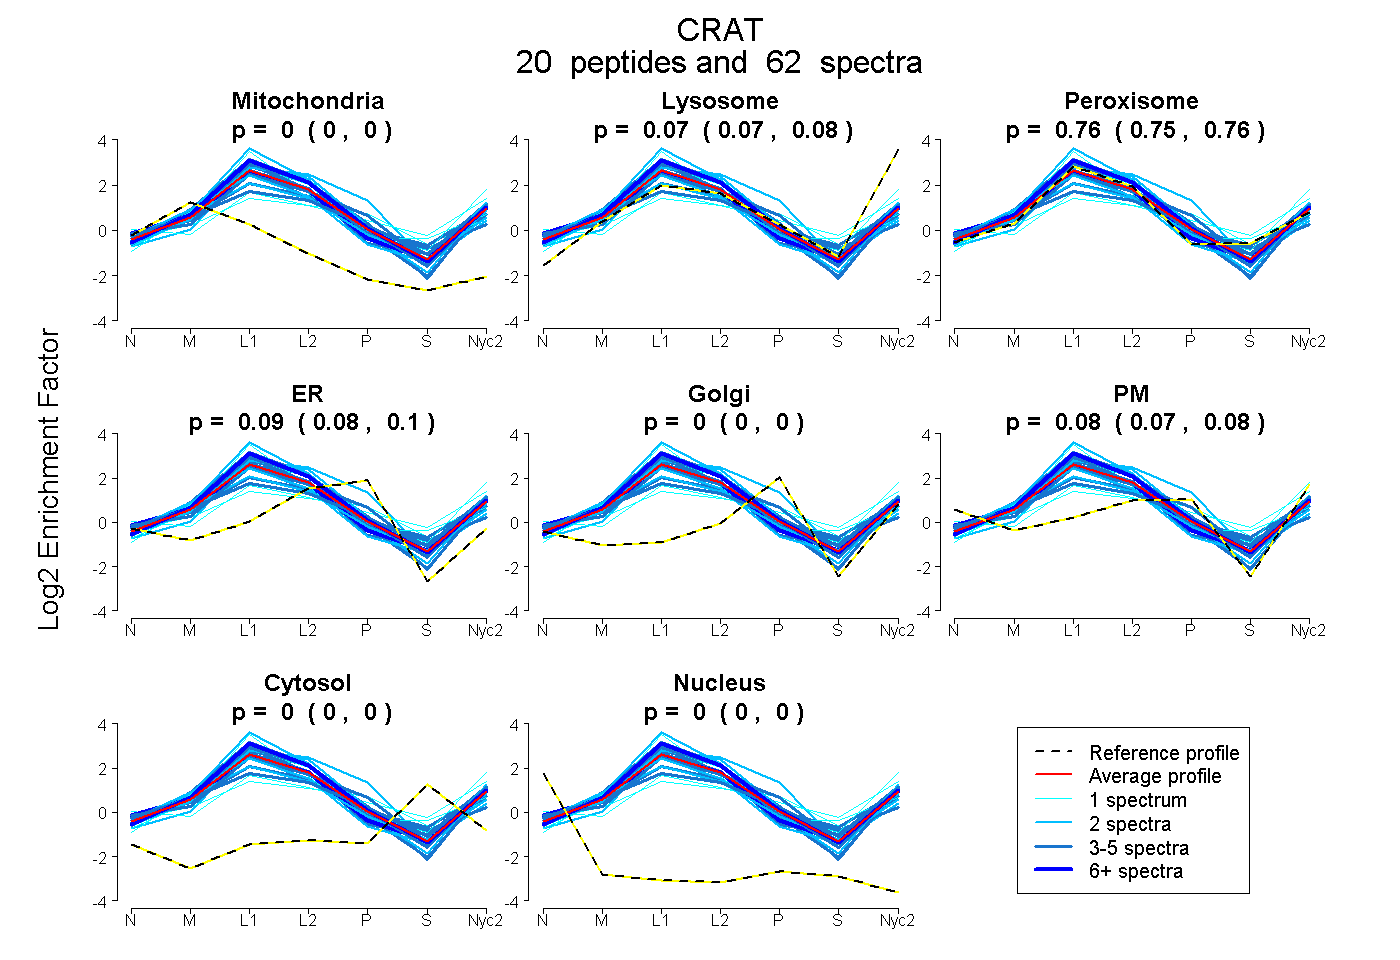
| Expt A |
20 peptides |
62 spectra |
|
0.000 0.000 | 0.002 |
0.075 0.069 | 0.080 |
0.758 0.750 | 0.765 |
0.090 0.082 | 0.097 |
0.000 0.000 | 0.000 |
0.077 0.068 | 0.084 |
0.000 0.000 | 0.000 |
0.000 0.000 | 0.000 |
| 1 spectrum, LPVPPLQQSLDHYLK | 0.000 | 0.000 | 1.000 | 0.000 | 0.000 | 0.000 | 0.000 | 0.000 | ||
| 3 spectra, LIEGVLDFK | 0.028 | 0.081 | 0.743 | 0.000 | 0.138 | 0.011 | 0.000 | 0.000 | ||
| 2 spectra, TAYLQFR | 0.155 | 0.138 | 0.662 | 0.000 | 0.000 | 0.046 | 0.000 | 0.000 | ||
| 2 spectra, QDSVVNFLK | 0.000 | 0.195 | 0.675 | 0.130 | 0.000 | 0.000 | 0.000 | 0.000 | ||
| 7 spectra, QDFMDLQGQLR | 0.035 | 0.014 | 0.790 | 0.000 | 0.000 | 0.161 | 0.000 | 0.000 | ||
| 5 spectra, MFHLGR | 0.000 | 0.142 | 0.814 | 0.011 | 0.000 | 0.033 | 0.000 | 0.000 | ||
| 3 spectra, ESVNSIQK | 0.054 | 0.000 | 0.886 | 0.000 | 0.000 | 0.059 | 0.000 | 0.000 | ||
| 4 spectra, SHVAGQMLHGGGSK | 0.000 | 0.094 | 0.598 | 0.136 | 0.000 | 0.172 | 0.000 | 0.000 | ||
| 2 spectra, AHQDALPR | 0.000 | 0.028 | 0.636 | 0.337 | 0.000 | 0.000 | 0.000 | 0.000 | ||
| 2 spectra, SASTDSLAFVK | 0.130 | 0.061 | 0.639 | 0.073 | 0.000 | 0.097 | 0.000 | 0.000 | ||
| 3 spectra, ALQPIVSEEEWAHTK | 0.071 | 0.000 | 0.816 | 0.114 | 0.000 | 0.000 | 0.000 | 0.000 | ||
| 10 spectra, VSDDVYR | 0.000 | 0.114 | 0.807 | 0.078 | 0.000 | 0.000 | 0.000 | 0.000 | ||
| 2 spectra, MAHYLEK | 0.000 | 0.155 | 0.834 | 0.011 | 0.000 | 0.000 | 0.000 | 0.000 | ||
| 1 spectrum, IYGQACATYESASLR | 0.000 | 0.000 | 0.635 | 0.000 | 0.339 | 0.000 | 0.026 | 0.000 | ||
| 1 spectrum, GEAFDR | 0.000 | 0.123 | 0.487 | 0.000 | 0.000 | 0.281 | 0.109 | 0.000 | ||
| 4 spectra, HLLGLK | 0.000 | 0.131 | 0.636 | 0.118 | 0.000 | 0.116 | 0.000 | 0.000 | ||
| 1 spectrum, MENWLSEWWLK | 0.000 | 0.348 | 0.652 | 0.000 | 0.000 | 0.000 | 0.000 | 0.000 | ||
| 3 spectra, VPEQQR | 0.000 | 0.119 | 0.756 | 0.098 | 0.000 | 0.027 | 0.000 | 0.000 | ||
| 3 spectra, ALLDMR | 0.022 | 0.146 | 0.754 | 0.078 | 0.000 | 0.000 | 0.000 | 0.000 | ||
| 3 spectra, TLLQNHPR | 0.060 | 0.083 | 0.572 | 0.000 | 0.072 | 0.213 | 0.000 | 0.000 |
| Plot | Mito | Lyso or Perox | ER | Golgi | PM | Cytosol | Nucleus | ||||||
| Expt B |
7 peptides |
17 spectra |
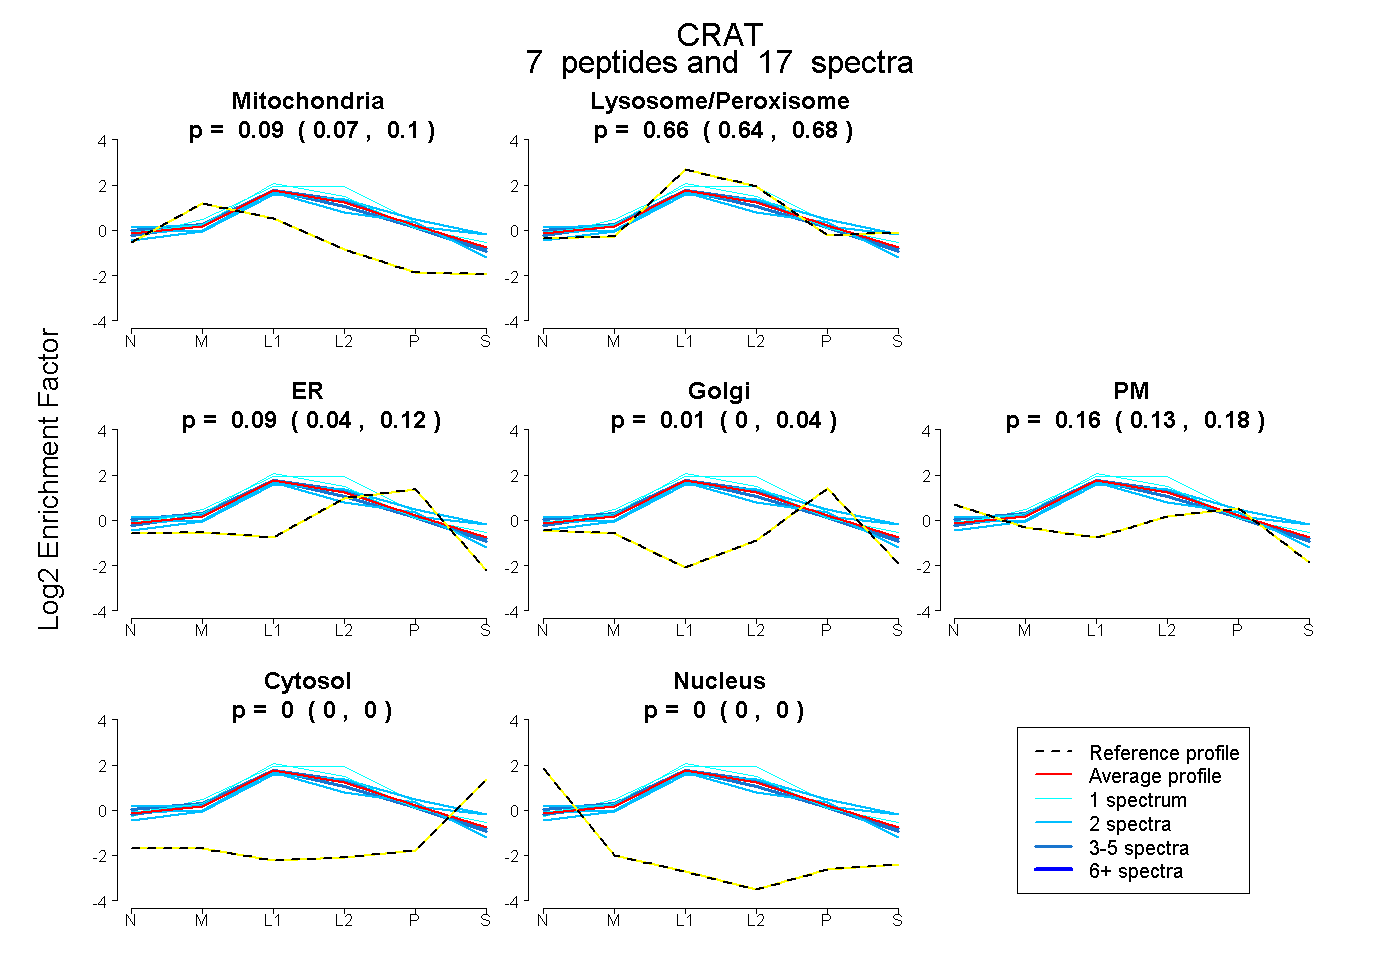 |
0.086 0.068 | 0.100 |
0.655 0.639 | 0.676 |
0.090 0.041 | 0.115 |
0.005 0.000 | 0.042 |
0.163 0.133 | 0.184 |
0.000 0.000 | 0.000 |
0.000 0.000 | 0.000 |
|||
| Plot | Lyso | Other | |||||||||||
| Expt C |
29 peptides |
279 spectra |
 |
0.000 0.000 | 0.000 |
1.000 1.000 | 1.000 |
||||||||
| Plot | Lyso | Other | |||||||||||
| Expt D |
13 peptides |
38 spectra |
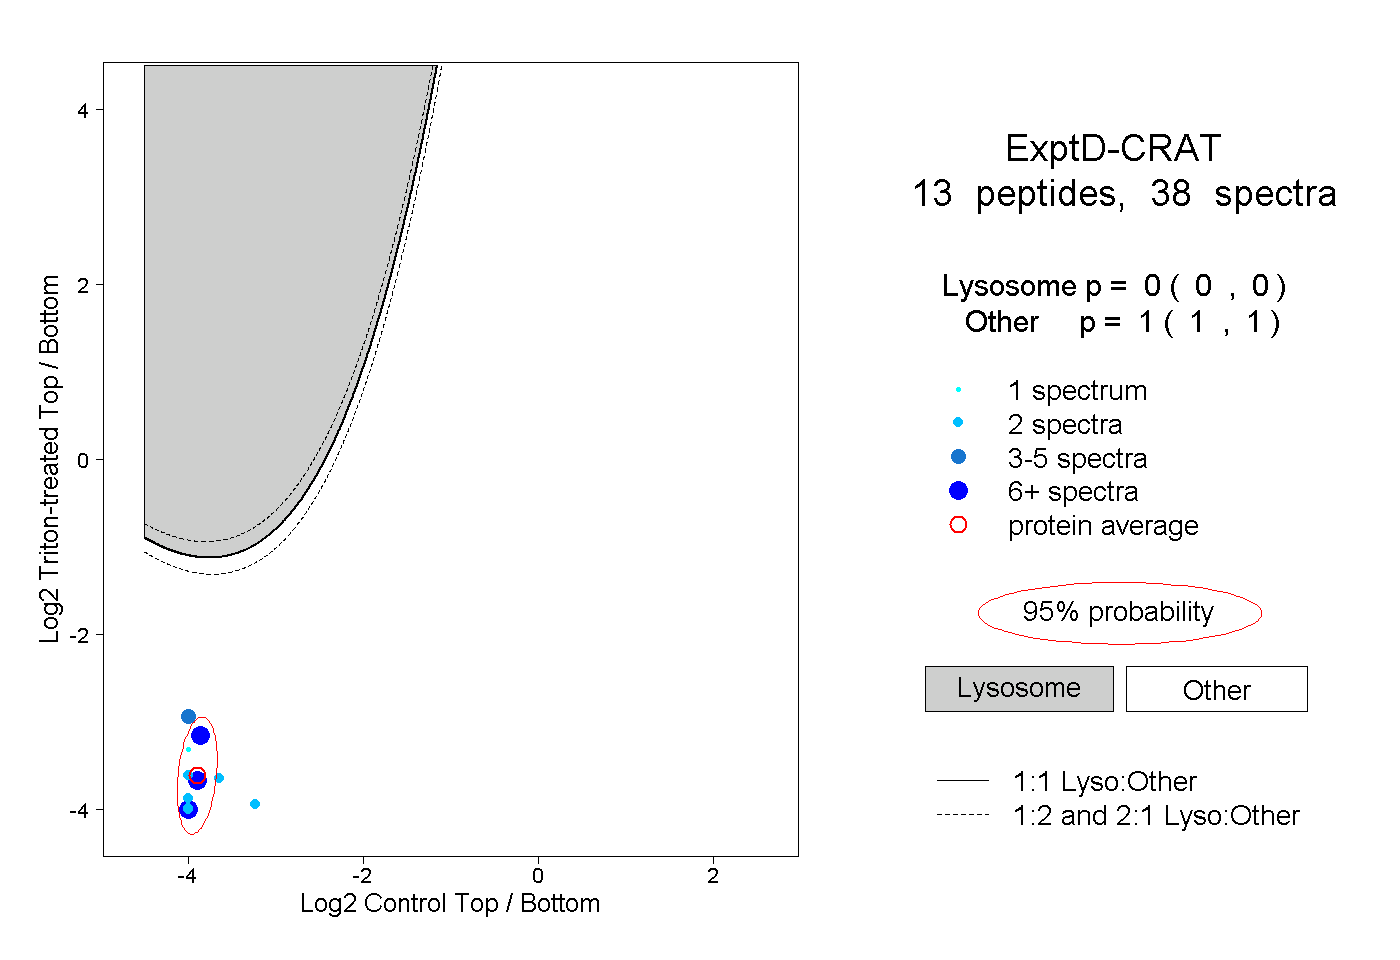 |
0.000 0.000 | 0.000 |
1.000 1.000 | 1.000 |