 15
15peptides
spectra
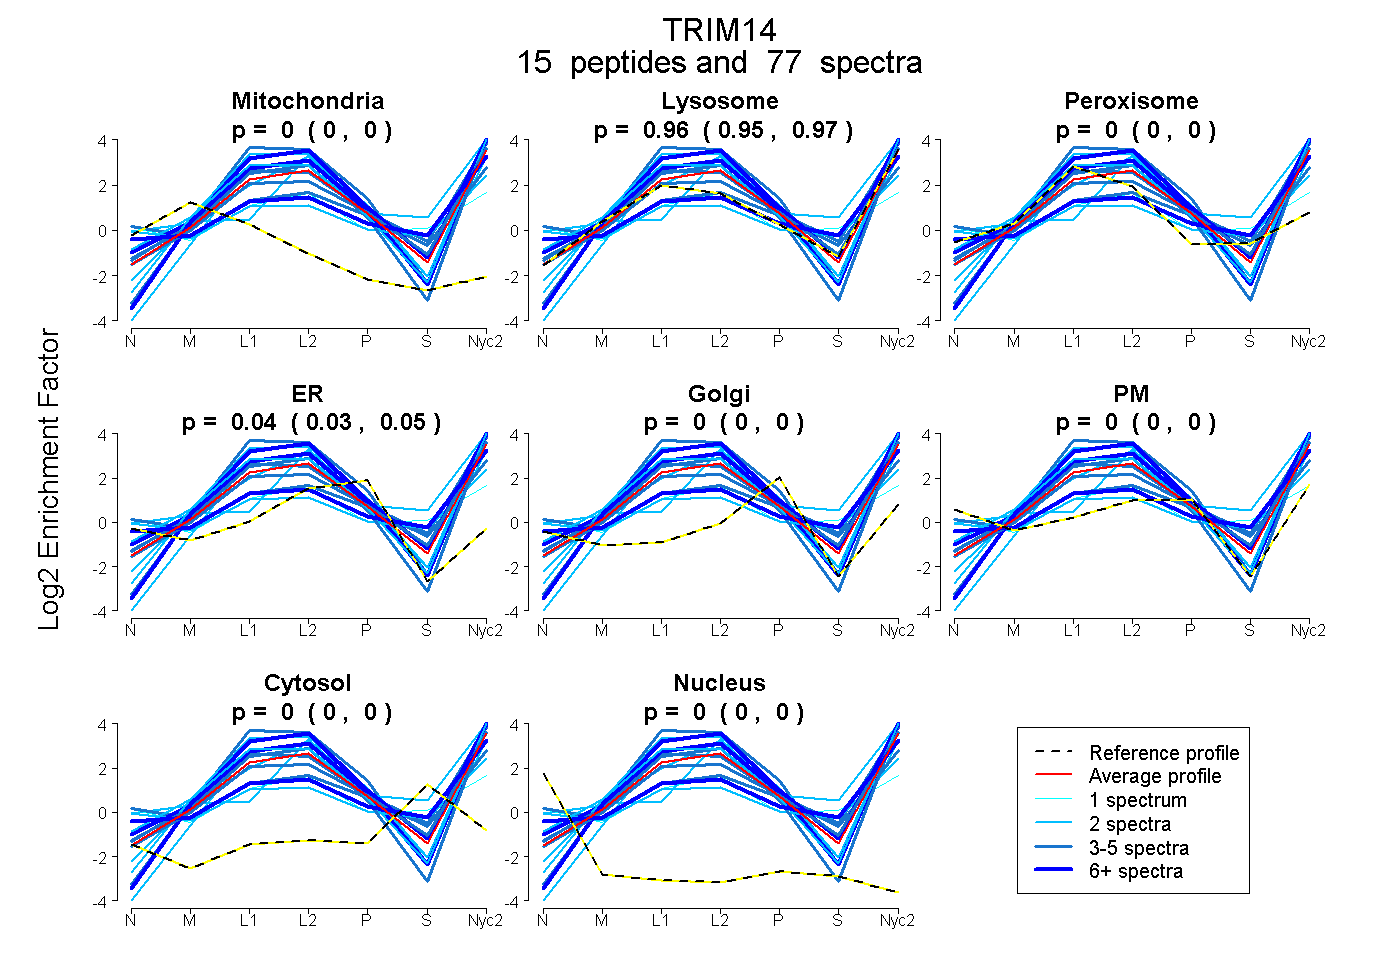
0.000 | 0.000
0.953 | 0.969
0.000 | 0.000
0.030 | 0.046
0.000 | 0.000
0.000 | 0.000
0.000 | 0.000
0.000 | 0.000
12peptides
spectra
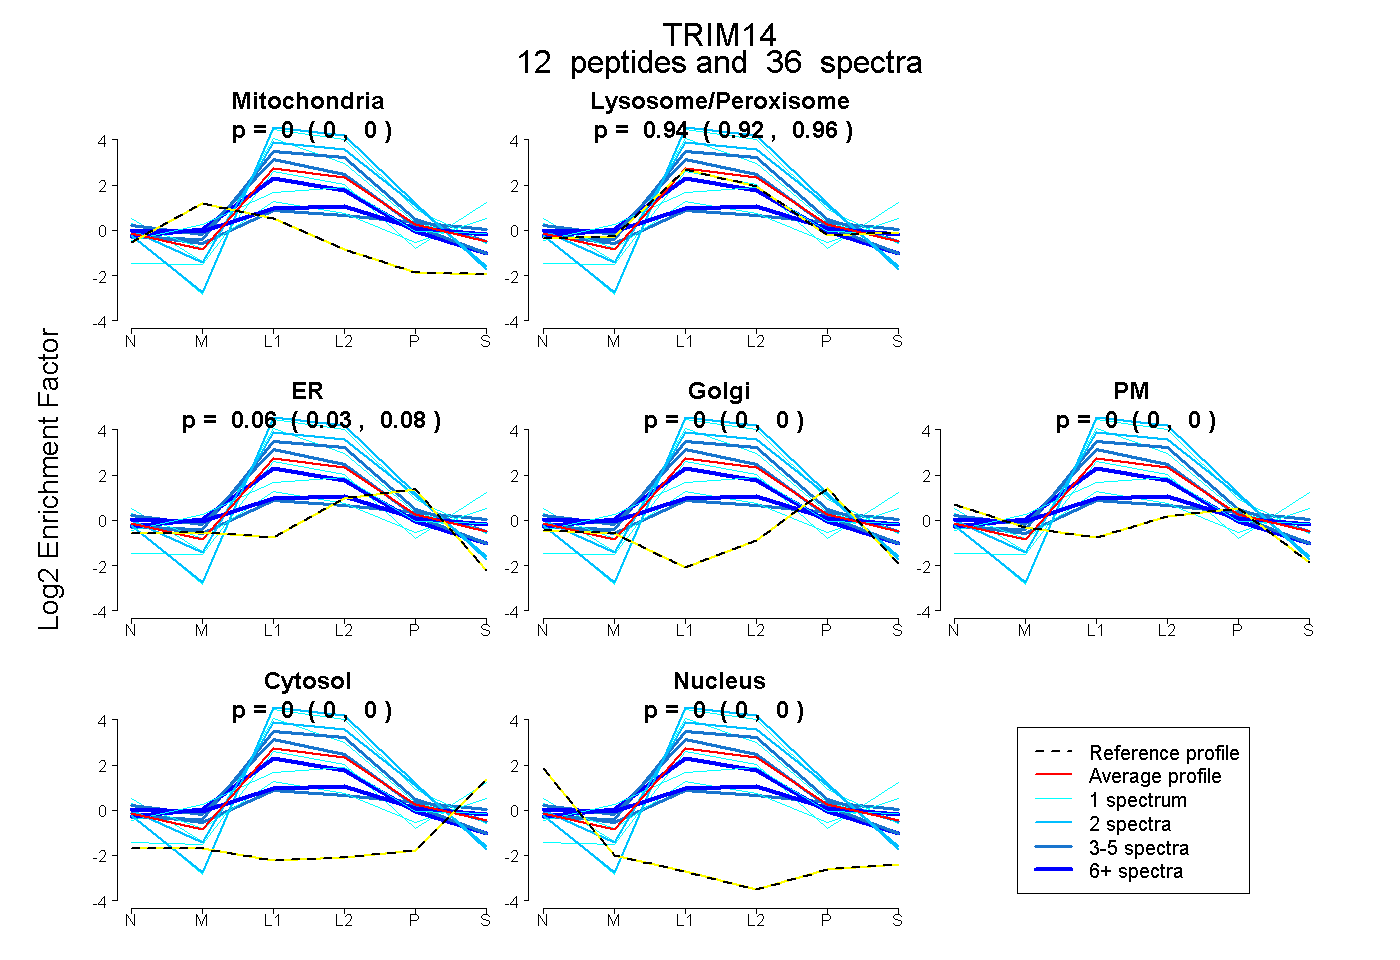
0.000 | 0.000
0.918 | 0.963
0.032 | 0.078
0.000 | 0.000
0.000 | 0.000
0.000 | 0.000
0.000 | 0.000
17peptides
spectra
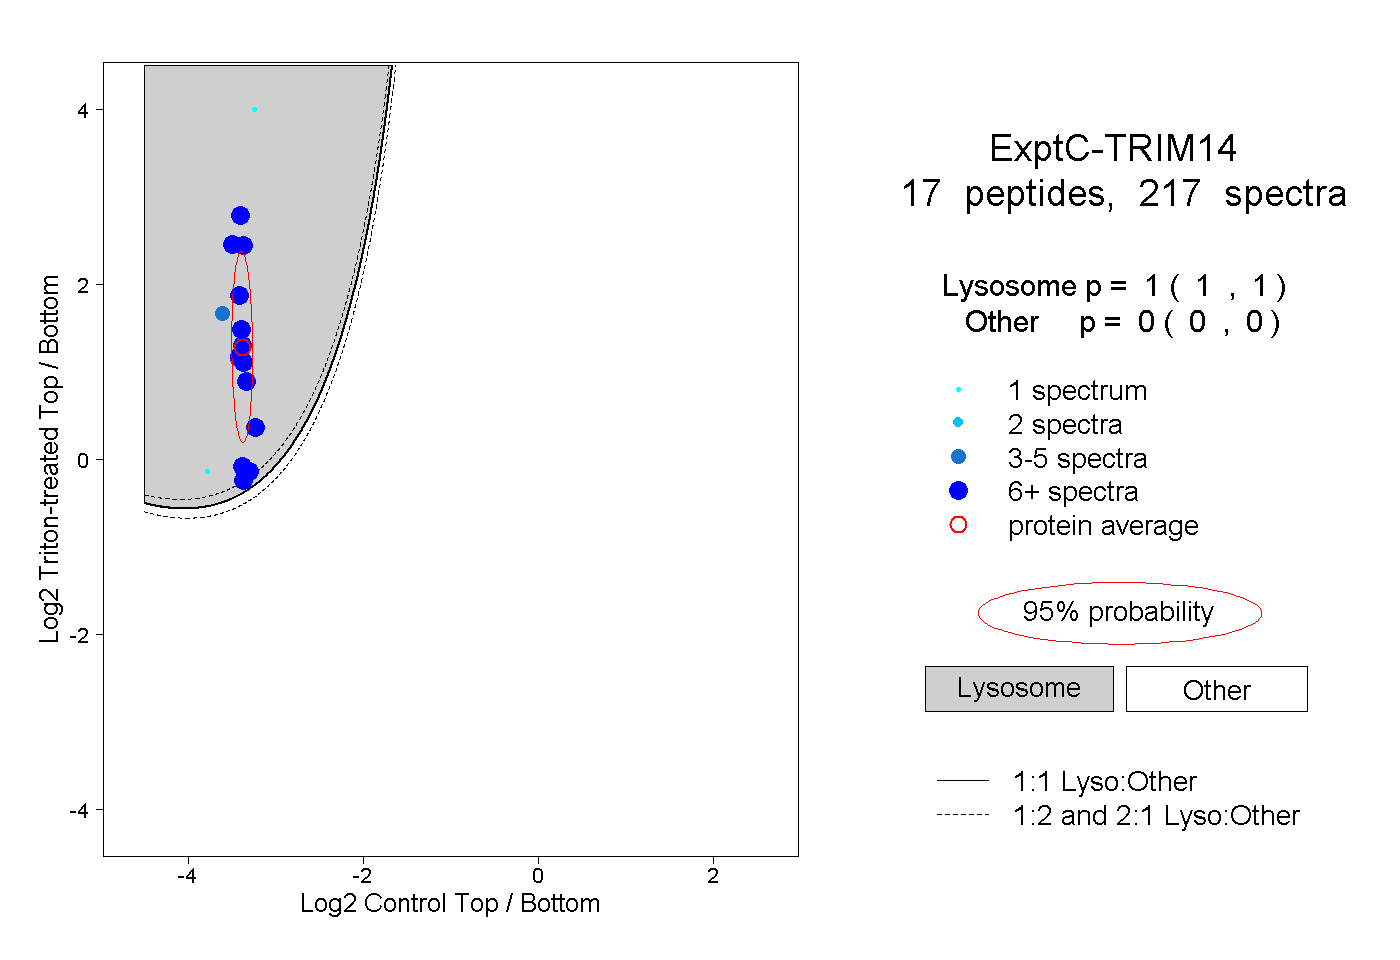
1.000 | 1.000
0.000 | 0.000
4peptides
spectra
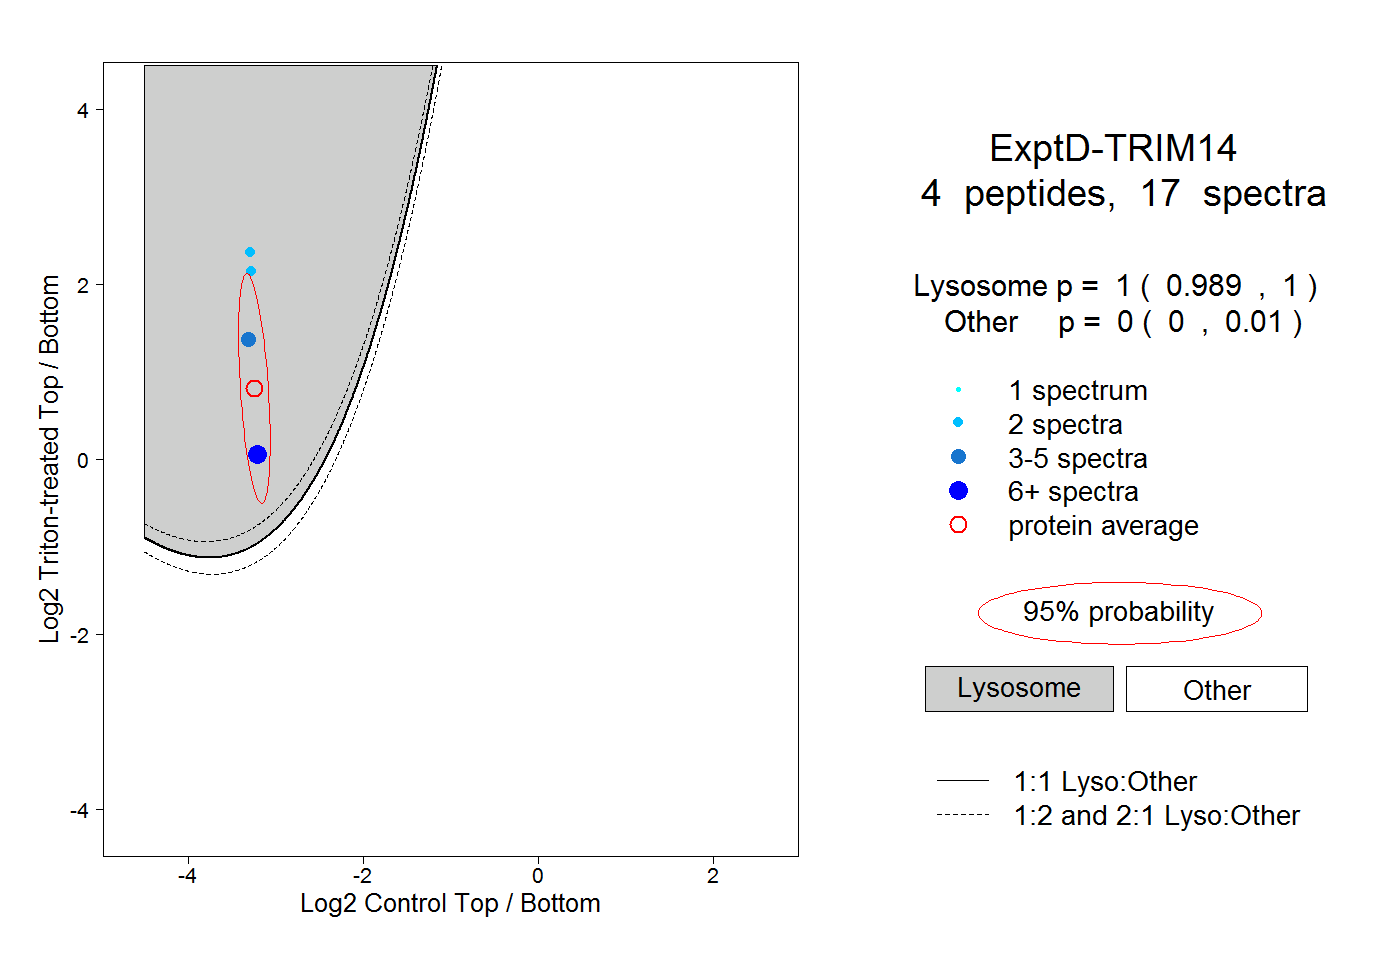
0.989 | 1.000
0.000 | 0.010