 15
15peptides
spectra
0.000 | 0.000
0.953 | 0.969
0.000 | 0.000
0.030 | 0.046
0.000 | 0.000
0.000 | 0.000
0.000 | 0.000
0.000 | 0.000
| Plot | Mito | Lyso | Perox | ER | Golgi | PM | Cytosol | Nucleus | |||||
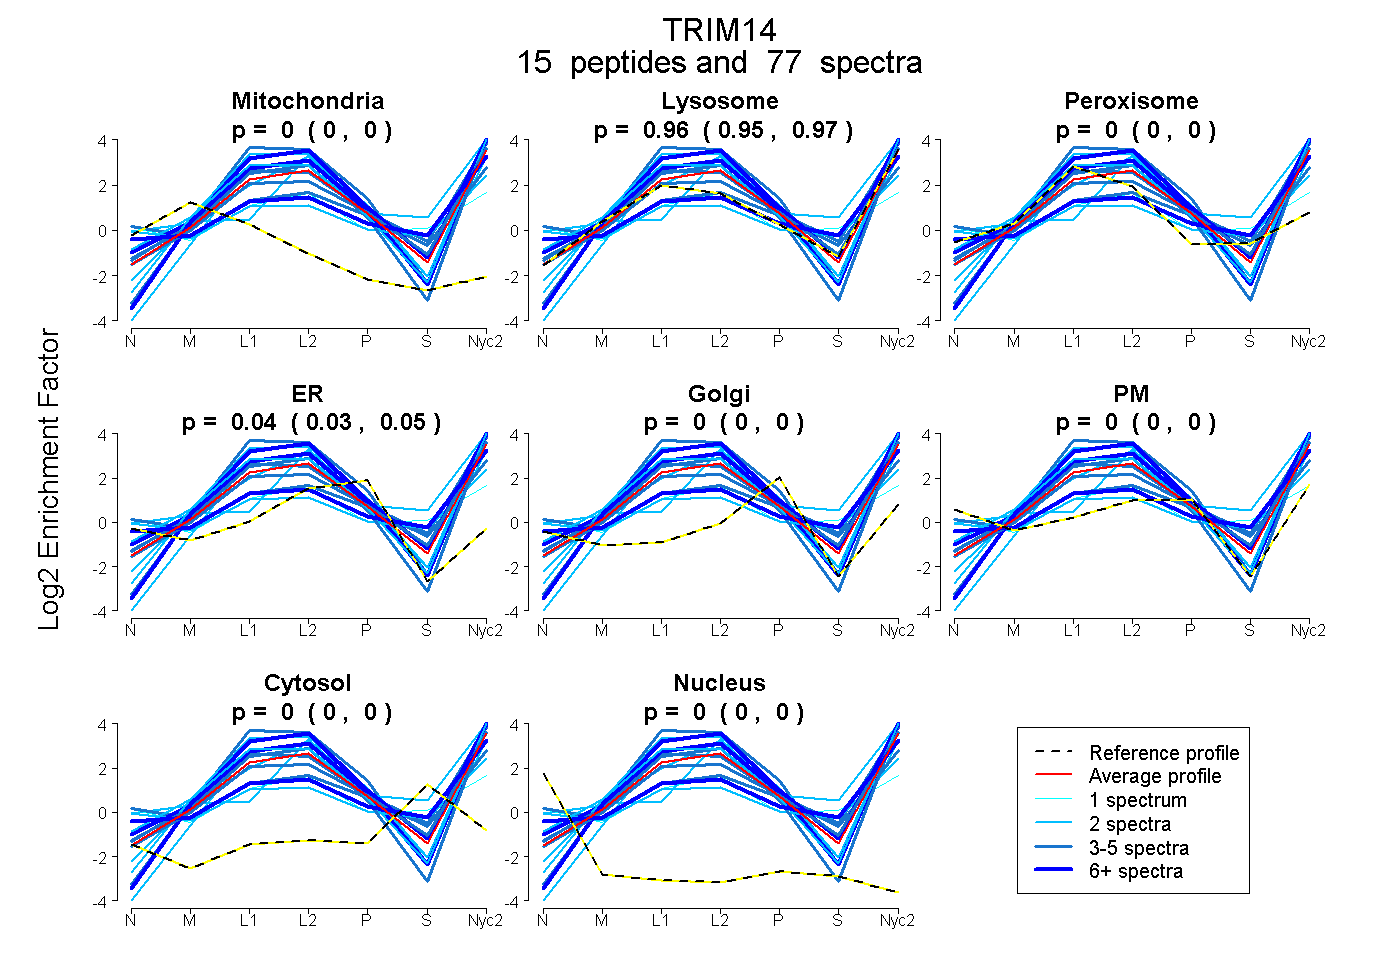
| Expt A |
15 peptides |
77 spectra |
|
0.000 0.000 | 0.000 |
0.961 0.953 | 0.969 |
0.000 0.000 | 0.000 |
0.039 0.030 | 0.046 |
0.000 0.000 | 0.000 |
0.000 0.000 | 0.000 |
0.000 0.000 | 0.000 |
0.000 0.000 | 0.000 |
| 3 spectra, GHPVGLAEEEAAR | 0.000 | 0.463 | 0.134 | 0.000 | 0.000 | 0.377 | 0.026 | 0.000 | ||
| 2 spectra, QIEVMSDFSIR | 0.000 | 1.000 | 0.000 | 0.000 | 0.000 | 0.000 | 0.000 | 0.000 | ||
| 7 spectra, YDMEYWAFHDCQR | 0.000 | 0.750 | 0.001 | 0.000 | 0.000 | 0.137 | 0.112 | 0.000 | ||
| 2 spectra, EFVEAIR | 0.000 | 1.000 | 0.000 | 0.000 | 0.000 | 0.000 | 0.000 | 0.000 | ||
| 1 spectrum, CPEHSERPAELFCR | 0.000 | 0.197 | 0.401 | 0.000 | 0.000 | 0.234 | 0.168 | 0.000 | ||
| 2 spectra, ASGTAEVR | 0.000 | 0.760 | 0.000 | 0.000 | 0.000 | 0.240 | 0.000 | 0.000 | ||
| 8 spectra, NTLQTPMDTR | 0.000 | 1.000 | 0.000 | 0.000 | 0.000 | 0.000 | 0.000 | 0.000 | ||
| 2 spectra, LSTDGLTVR | 0.000 | 1.000 | 0.000 | 0.000 | 0.000 | 0.000 | 0.000 | 0.000 | ||
| 5 spectra, LWEGTISIPR | 0.000 | 0.932 | 0.000 | 0.020 | 0.000 | 0.049 | 0.000 | 0.000 | ||
| 3 spectra, ESWCVK | 0.000 | 0.981 | 0.019 | 0.000 | 0.000 | 0.000 | 0.000 | 0.000 | ||
| 2 spectra, LLLDEEEALAK | 0.000 | 0.445 | 0.142 | 0.000 | 0.000 | 0.246 | 0.167 | 0.000 | ||
| 2 spectra, CVCALCPVLGAHR | 0.000 | 0.796 | 0.000 | 0.204 | 0.000 | 0.000 | 0.000 | 0.000 | ||
| 4 spectra, TPTLDPDTMHAR | 0.000 | 0.972 | 0.000 | 0.028 | 0.000 | 0.000 | 0.000 | 0.000 | ||
| 4 spectra, APVQSDWTGGWR | 0.000 | 1.000 | 0.000 | 0.000 | 0.000 | 0.000 | 0.000 | 0.000 | ||
| 30 spectra, LGPRPAPR | 0.000 | 0.985 | 0.000 | 0.015 | 0.000 | 0.000 | 0.000 | 0.000 |
| Plot | Mito | Lyso or Perox | ER | Golgi | PM | Cytosol | Nucleus | ||||||
| Expt B |
12 peptides |
36 spectra |
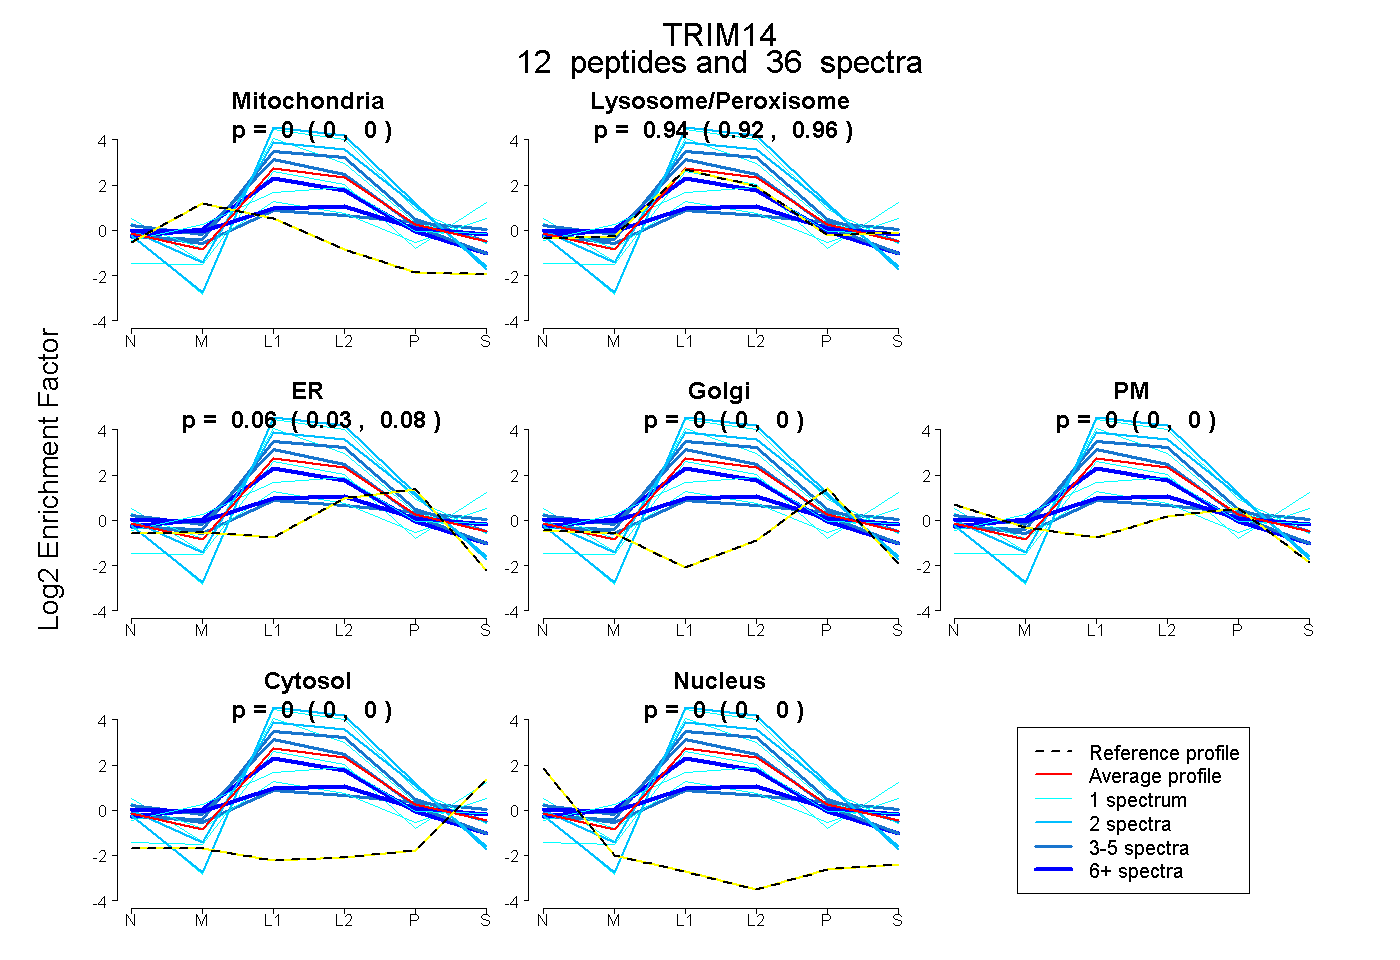 |
0.000 0.000 | 0.000 |
0.943 0.918 | 0.963 |
0.057 0.032 | 0.078 |
0.000 0.000 | 0.000 |
0.000 0.000 | 0.000 |
0.000 0.000 | 0.000 |
0.000 0.000 | 0.000 |
|||
| Plot | Lyso | Other | |||||||||||
| Expt C |
17 peptides |
217 spectra |
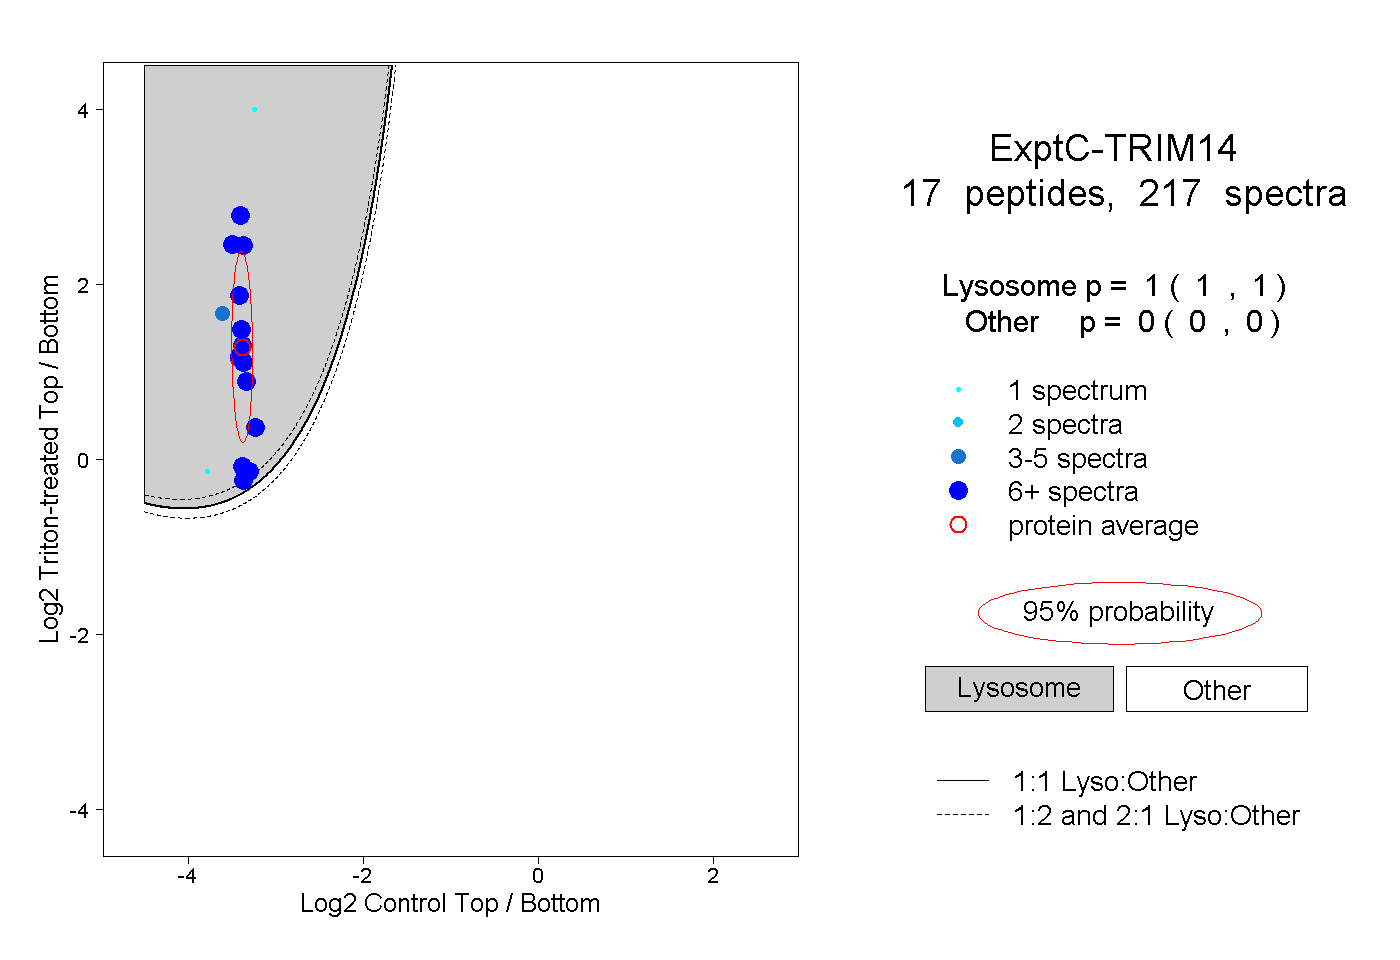 |
1.000 1.000 | 1.000 |
0.000 0.000 | 0.000 |
||||||||
| Plot | Lyso | Other | |||||||||||
| Expt D |
4 peptides |
17 spectra |
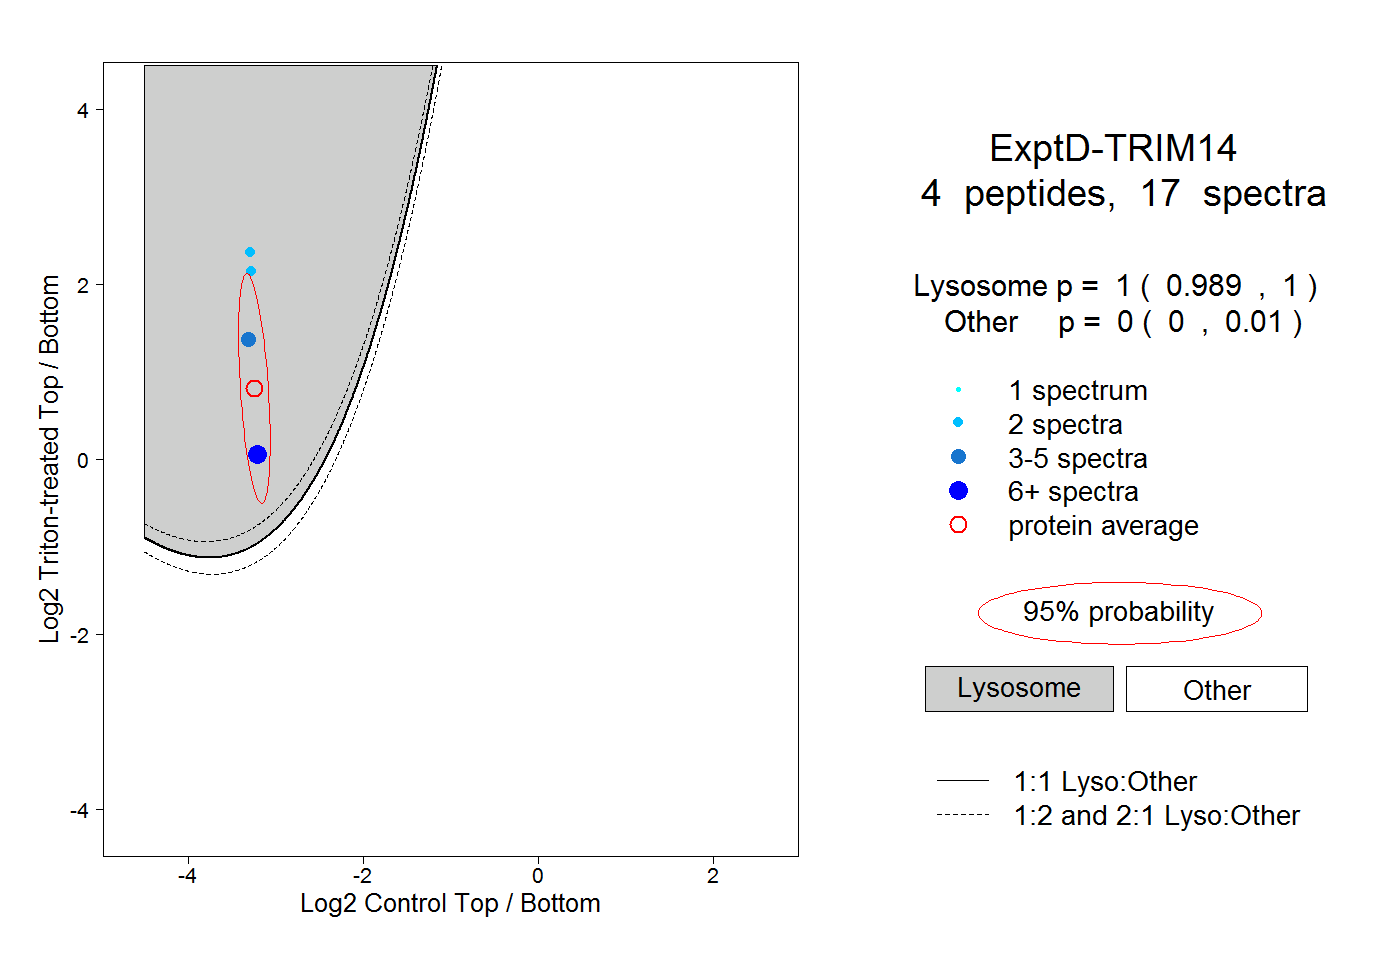 |
1.000 0.989 | 1.000 |
0.000 0.000 | 0.010 |