 25
25peptides
spectra
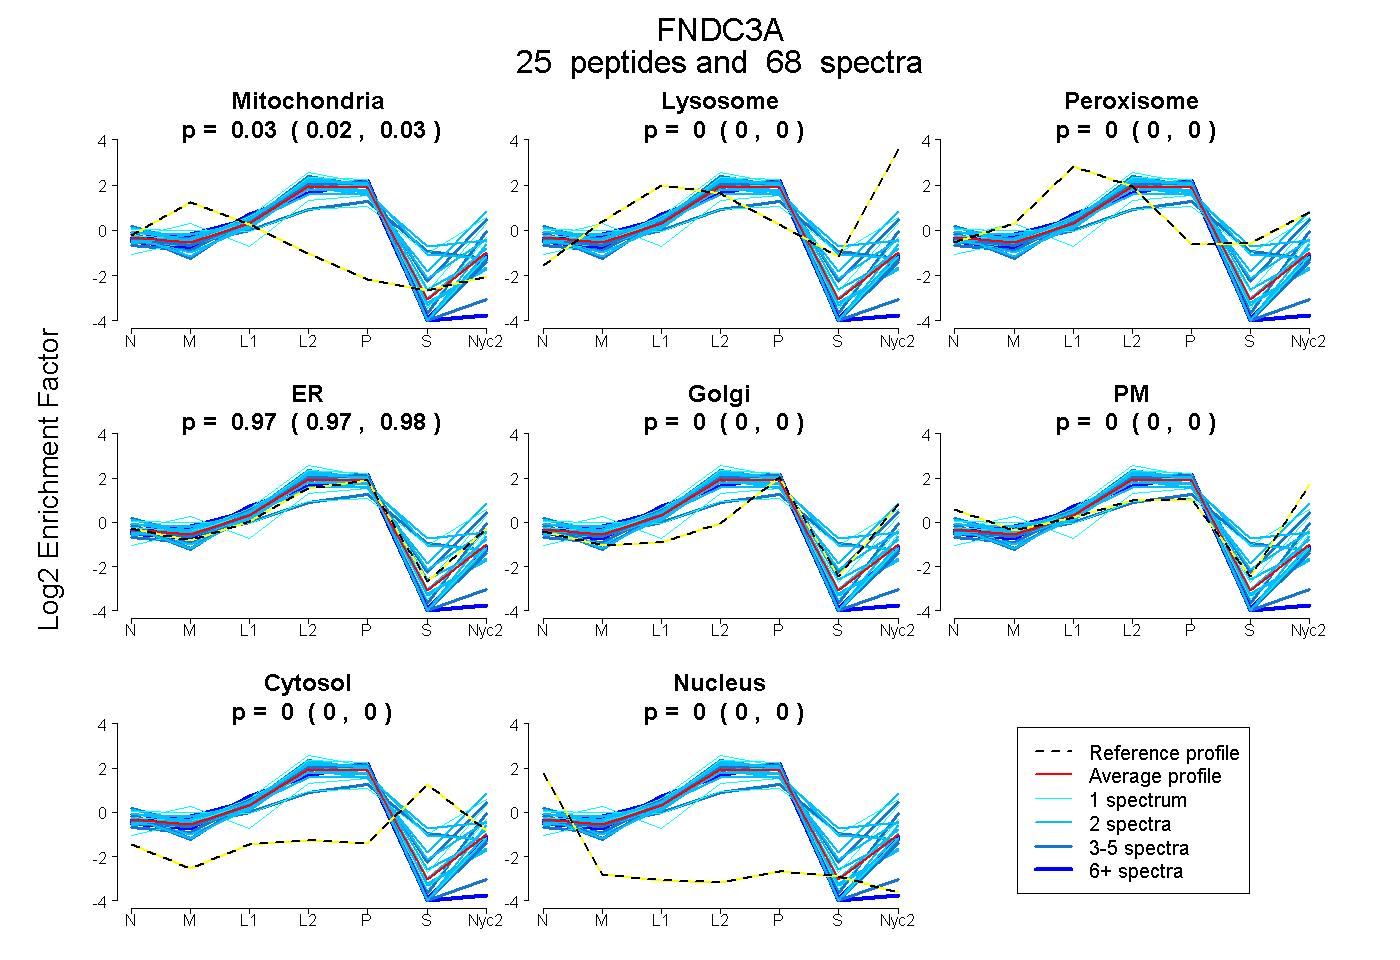
0.024 | 0.031
0.000 | 0.000
0.000 | 0.000
0.968 | 0.975
0.000 | 0.000
0.000 | 0.000
0.000 | 0.000
0.000 | 0.000
7peptides
spectra
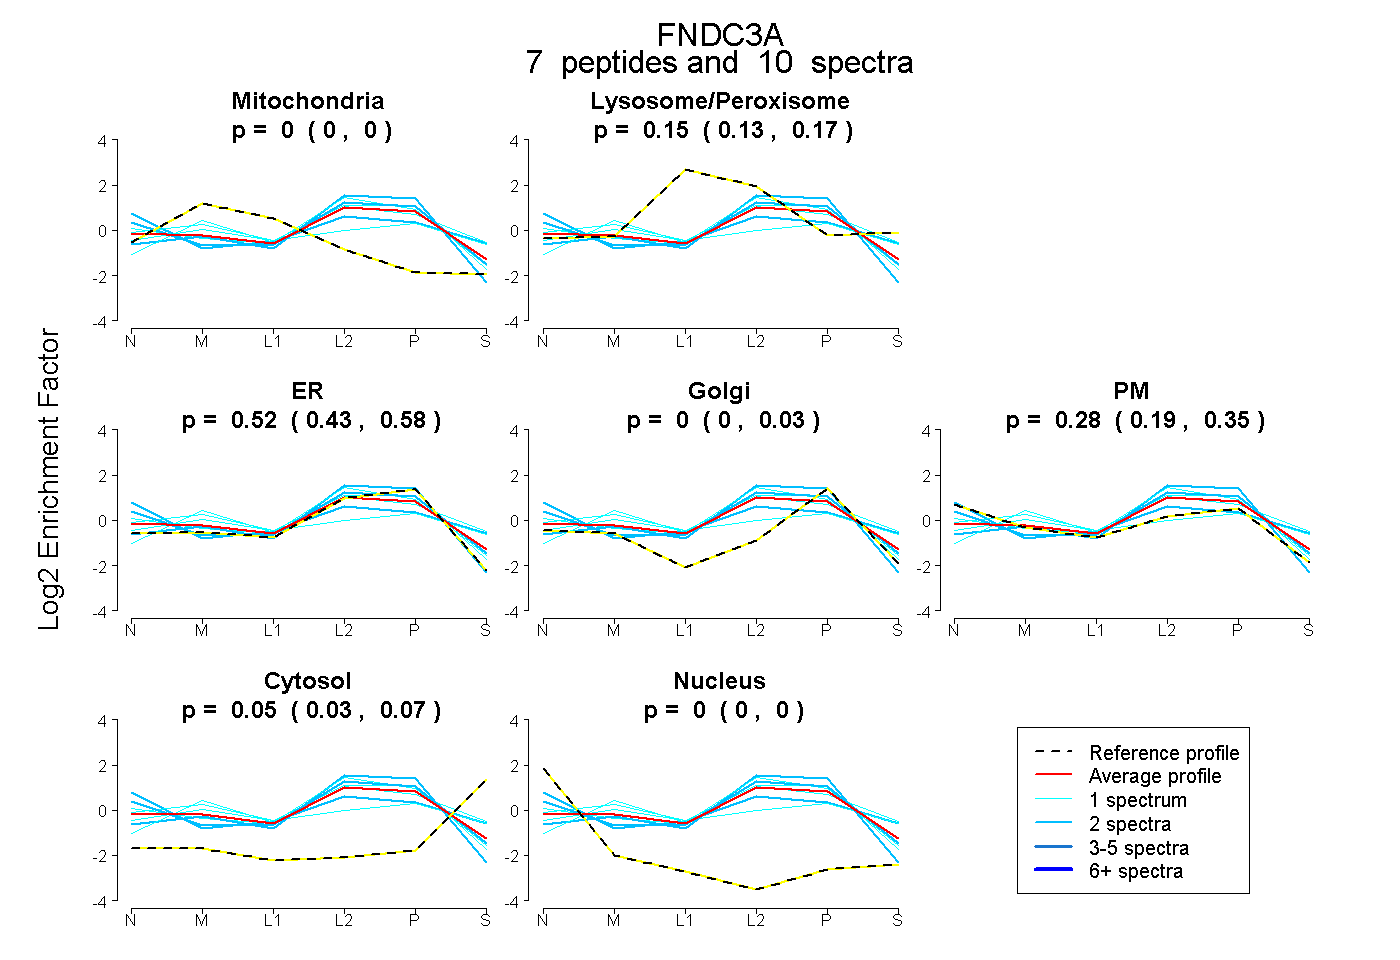
0.000 | 0.000
0.130 | 0.169
0.426 | 0.580
0.000 | 0.032
0.190 | 0.351
0.028 | 0.070
0.000 | 0.000
21peptides
spectra
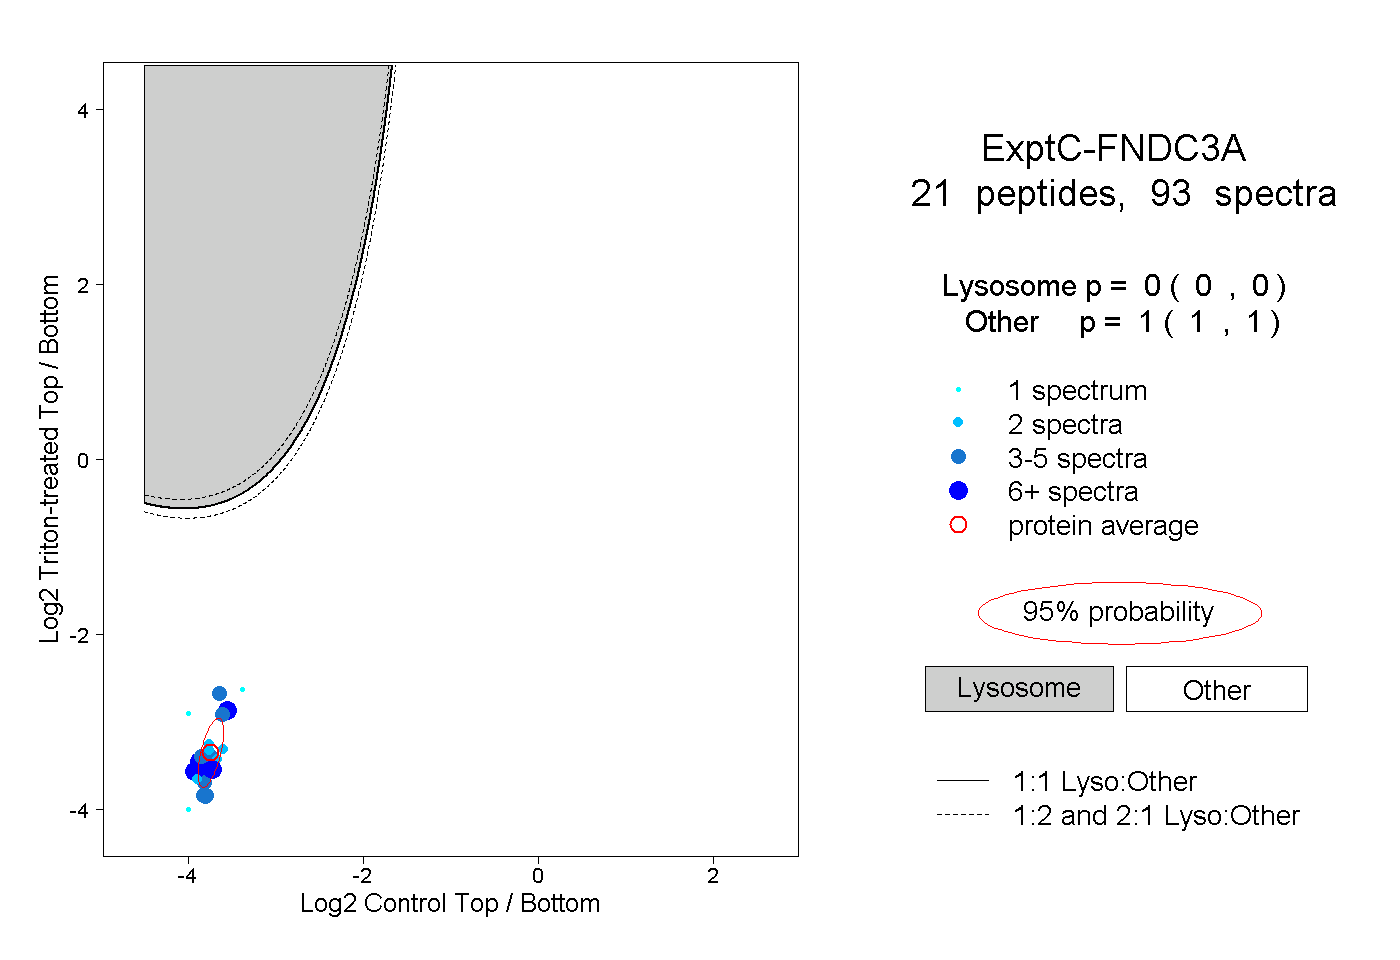
0.000 | 0.000
1.000 | 1.000
4peptides
spectra
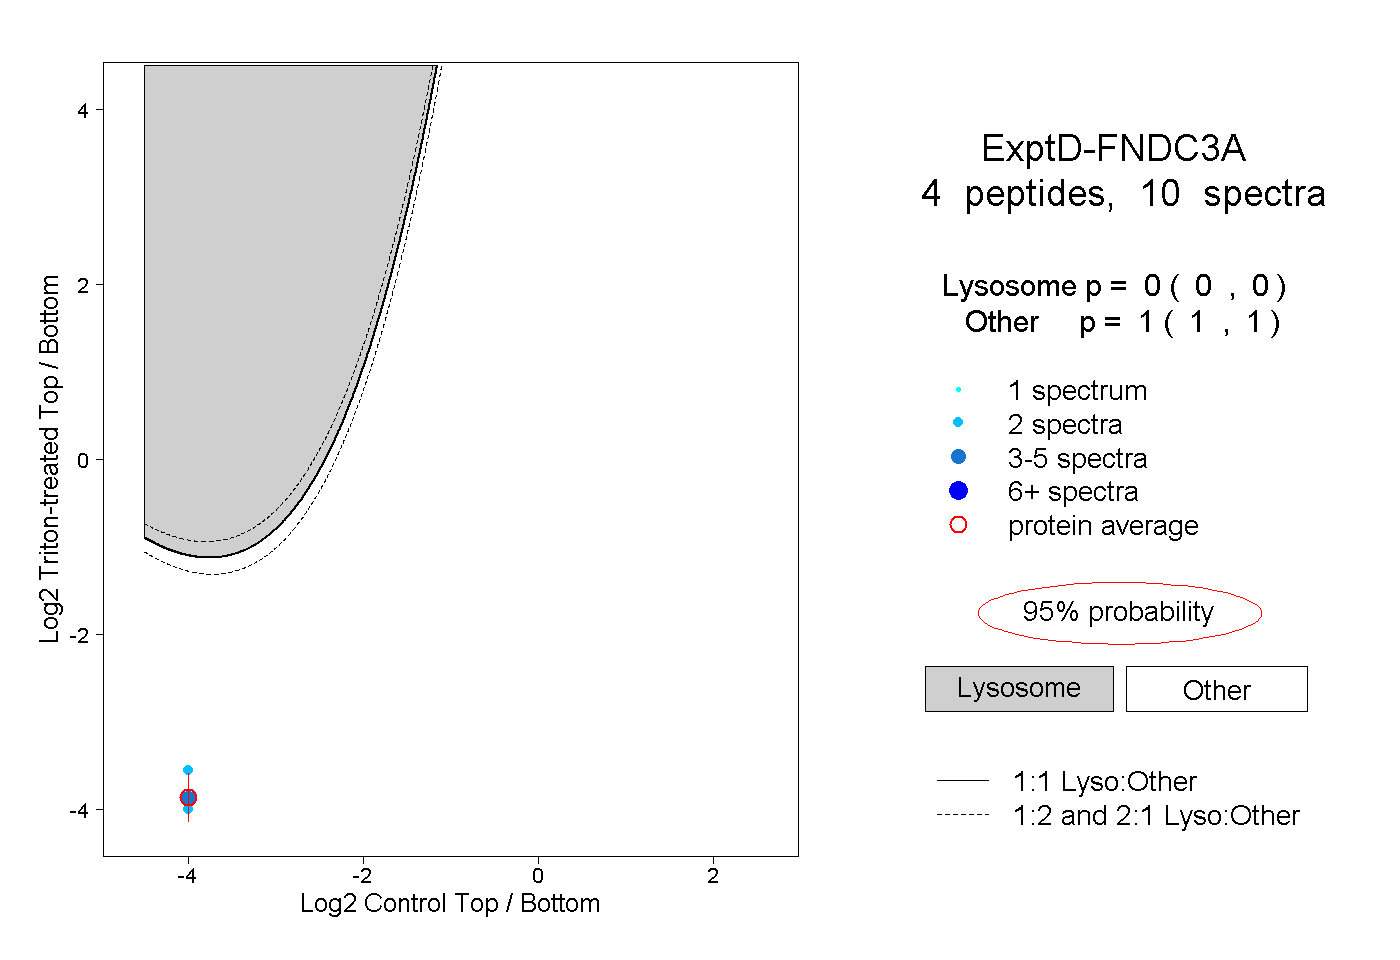
0.000 | 0.000
1.000 | 1.000