 2
2peptides
spectra
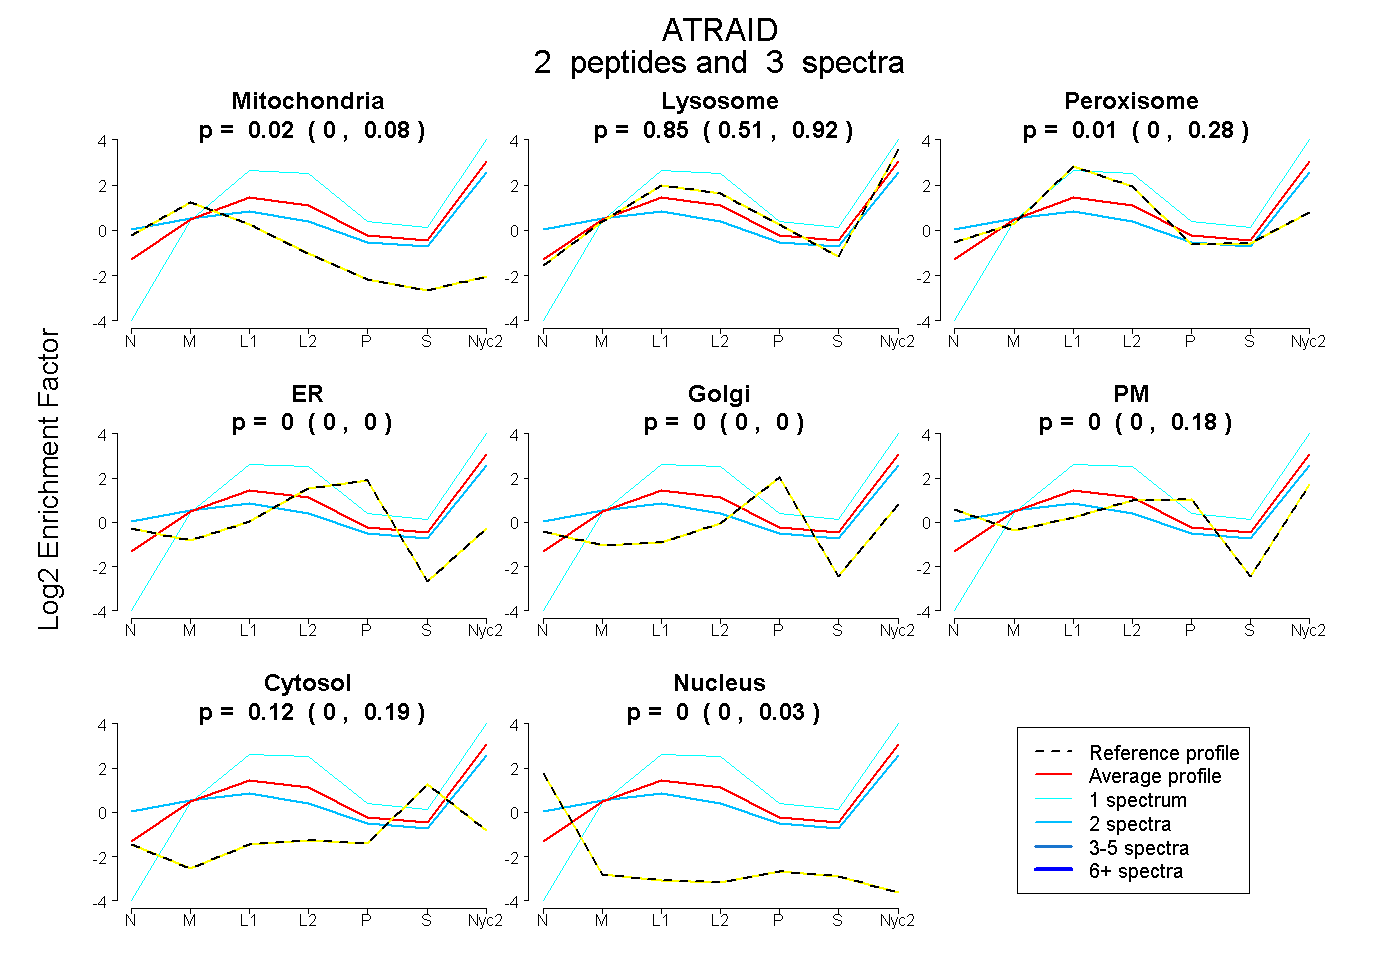
0.000 | 0.077
0.507 | 0.922
0.000 | 0.276
0.000 | 0.000
0.000 | 0.000
0.000 | 0.177
0.000 | 0.186
0.000 | 0.033
3peptides
spectra
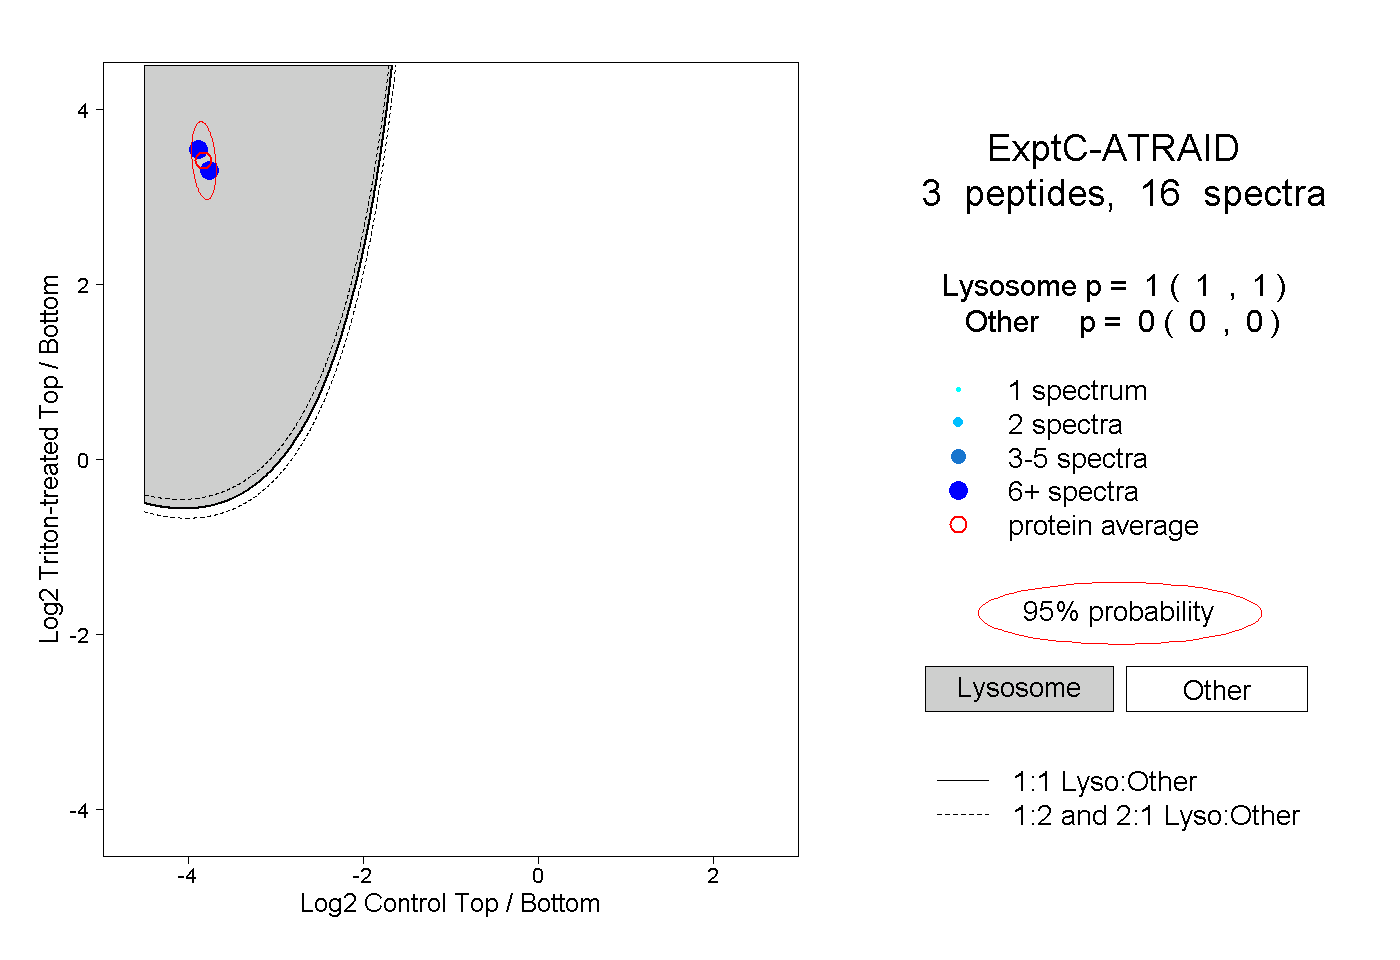
1.000 | 1.000
0.000 | 0.000
1peptide
spectrum
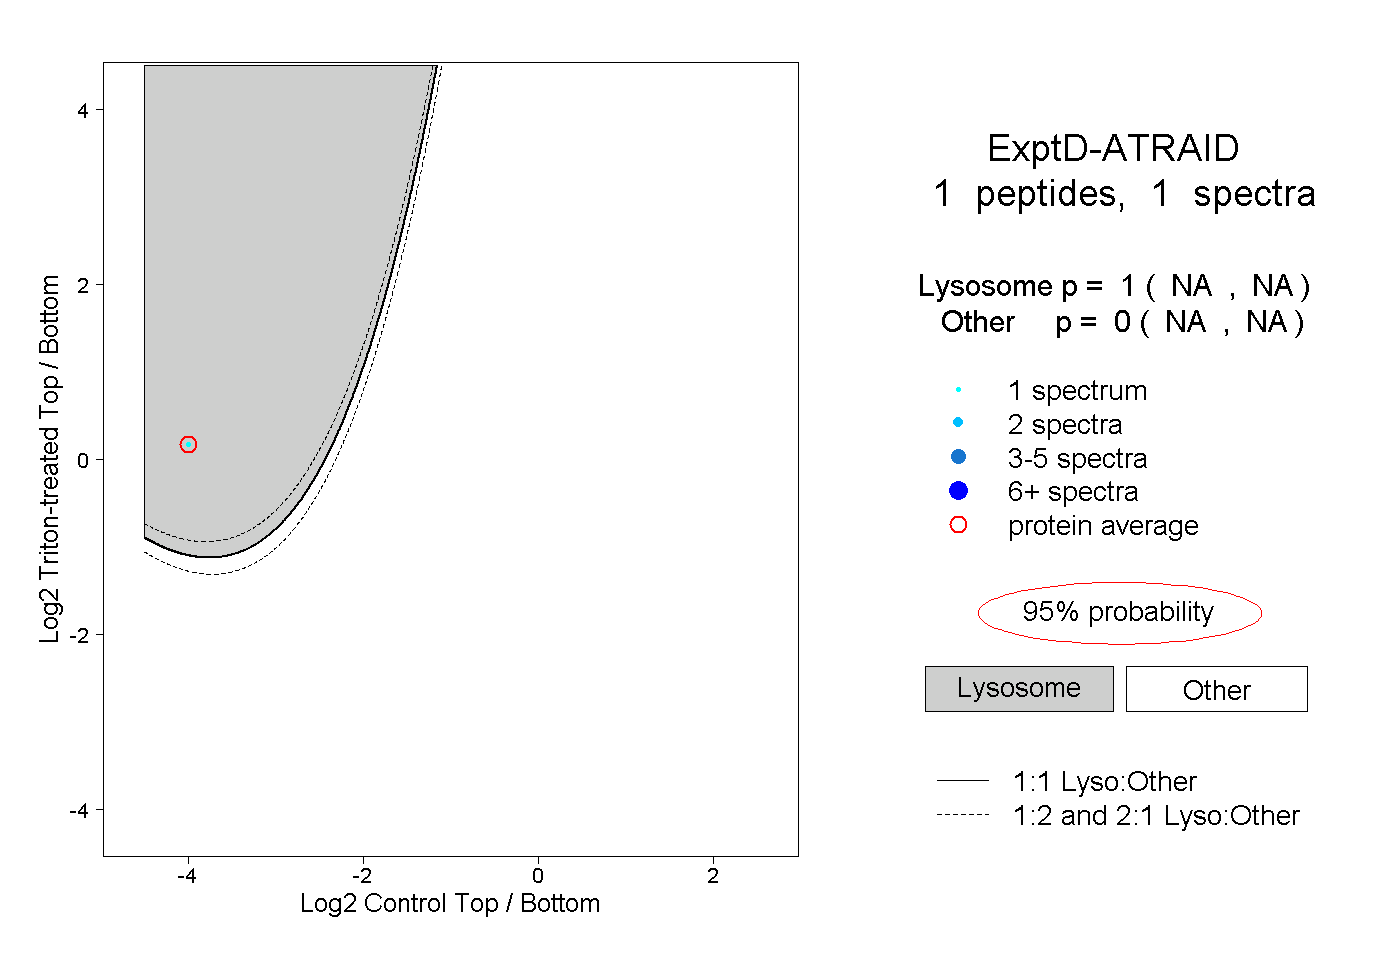
NA | NA
NA | NA