 2
2peptides
spectra
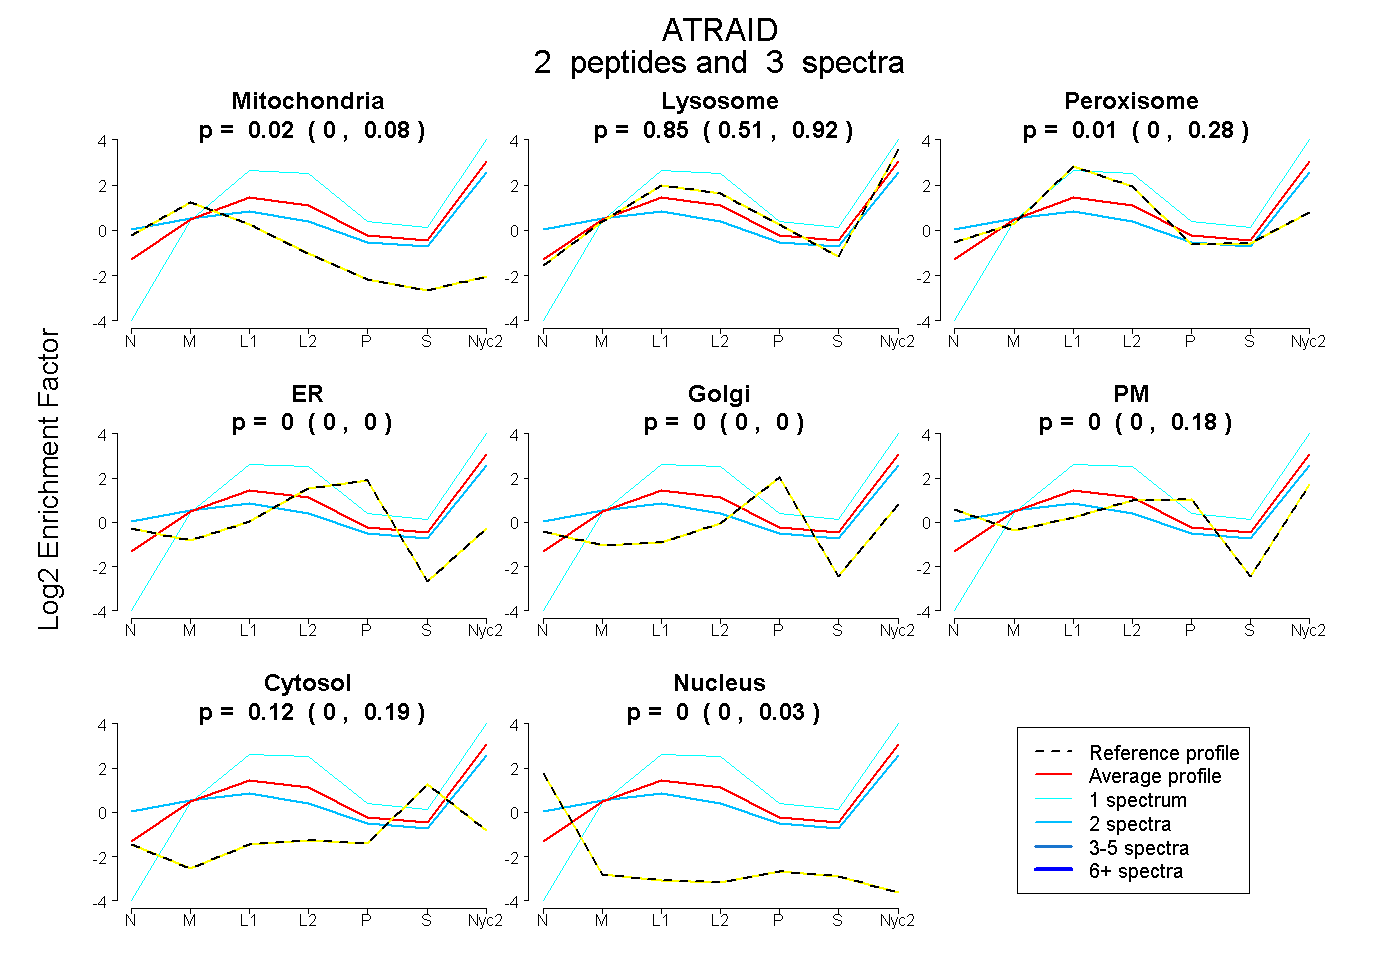
0.000 | 0.077
0.507 | 0.922
0.000 | 0.276
0.000 | 0.000
0.000 | 0.000
0.000 | 0.177
0.000 | 0.186
0.000 | 0.033
| Plot | Mito | Lyso | Perox | ER | Golgi | PM | Cytosol | Nucleus | |||||
| Expt A |
2 peptides |
3 spectra |
|
0.021 0.000 | 0.077 |
0.849 0.507 | 0.922 |
0.006 0.000 | 0.276 |
0.000 0.000 | 0.000 |
0.000 0.000 | 0.000 |
0.000 0.000 | 0.177 |
0.124 0.000 | 0.186 |
0.000 0.000 | 0.033 |
| 2 spectra, QICQGQK | 0.061 | 0.695 | 0.000 | 0.000 | 0.000 | 0.091 | 0.046 | 0.106 | ||
| 1 spectrum, VAAYCEDTSK | 0.000 | 1.000 | 0.000 | 0.000 | 0.000 | 0.000 | 0.000 | 0.000 |
| Plot | Lyso | Other | |||||||||||
| Expt C |
3 peptides |
16 spectra |
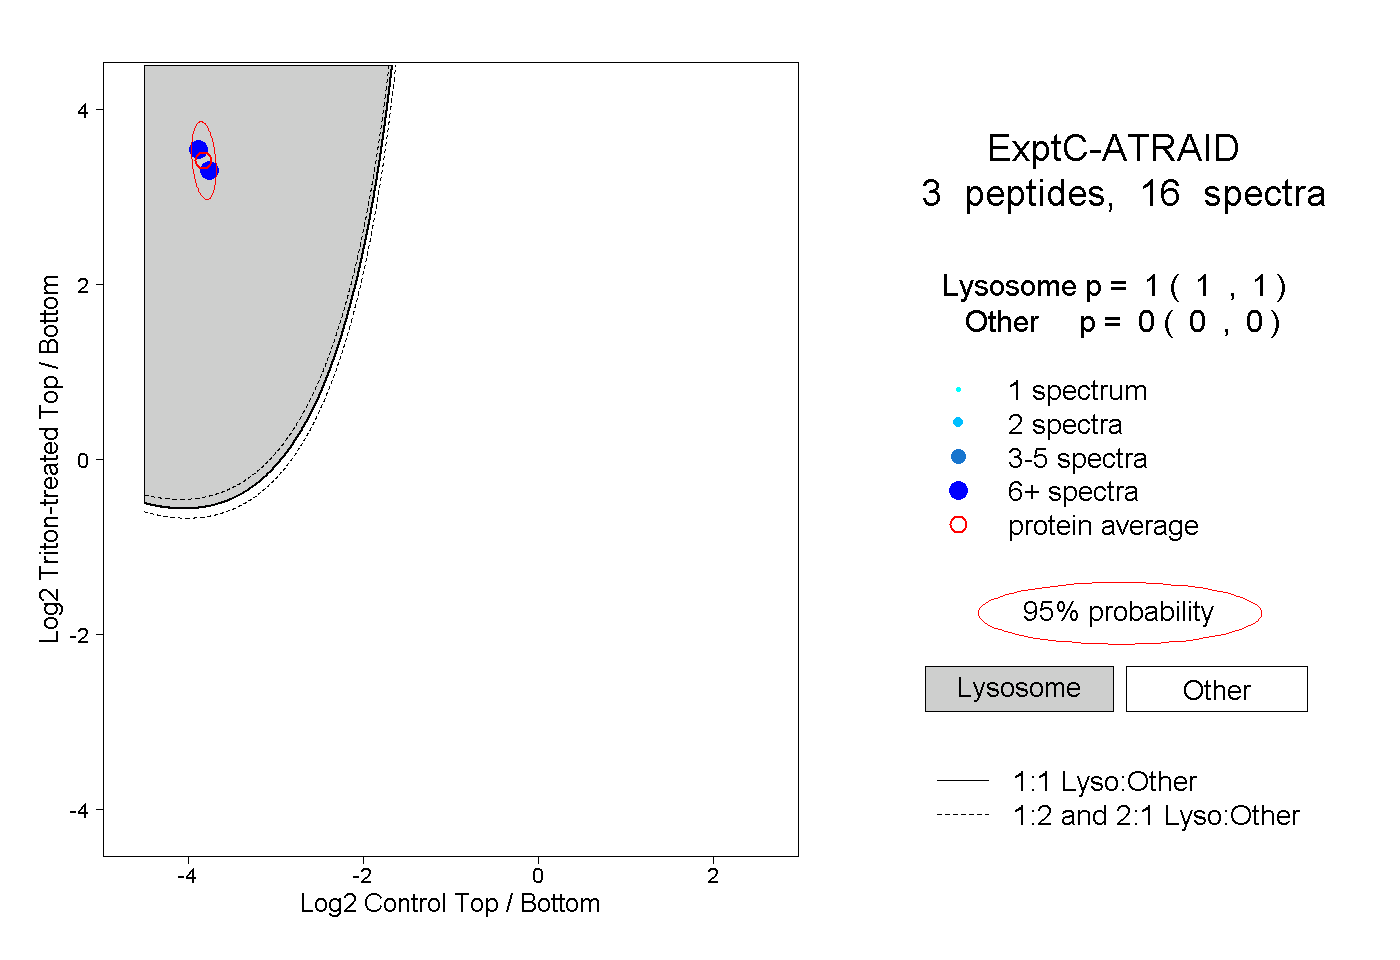 |
1.000 1.000 | 1.000 |
0.000 0.000 | 0.000 |
||||||||
| Plot | Lyso | Other | |||||||||||
| Expt D |
1 peptide |
1 spectrum |
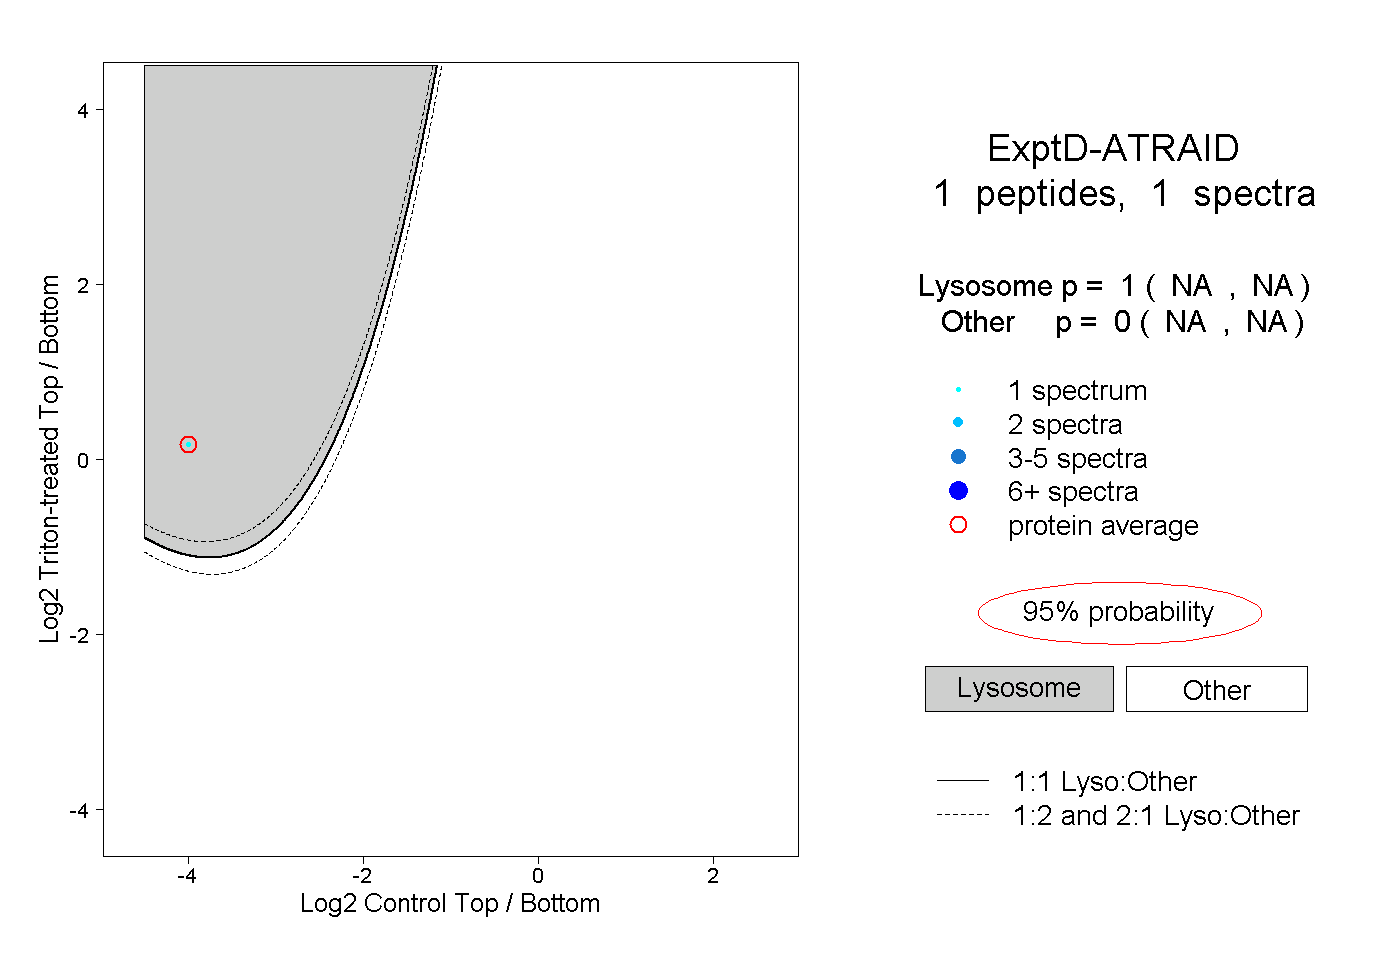 |
1.000 NA | NA |
0.000 NA | NA |