 5
5peptides
spectra

0.000 | 0.000
0.000 | 0.000
0.000 | 0.000
0.000 | 0.186
0.025 | 0.223
0.173 | 0.344
0.420 | 0.520
0.002 | 0.064
7peptides
spectra
0.000 | 0.000
1.000 | 1.000
| Plot | Mito | Lyso | Perox | ER | Golgi | PM | Cytosol | Nucleus | |||||
| Expt A |
5 peptides |
14 spectra |
|
0.000 0.000 | 0.000 |
0.000 0.000 | 0.000 |
0.000 0.000 | 0.000 |
0.081 0.000 | 0.186 |
0.138 0.025 | 0.223 |
0.271 0.173 | 0.344 |
0.477 0.420 | 0.520 |
0.034 0.002 | 0.064 |
||
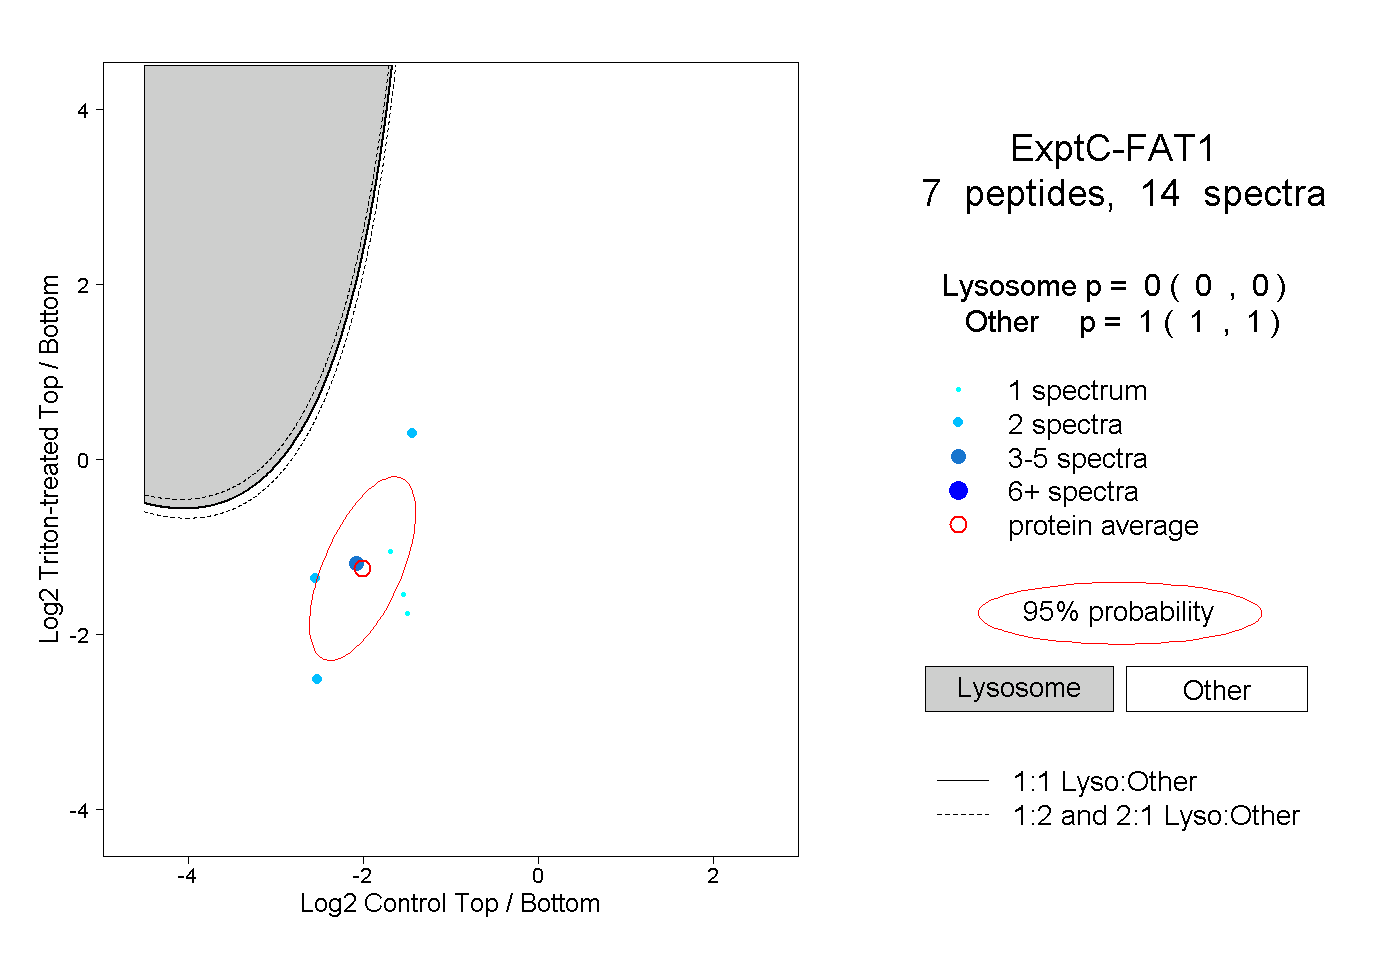
| Plot | Lyso | Other | |||||||||||
| Expt C |
7 peptides |
14 spectra |
|
0.000 0.000 | 0.000 |
1.000 1.000 | 1.000 |