 5
5peptides
spectra

0.000 | 0.000
0.000 | 0.000
0.000 | 0.000
0.000 | 0.186
0.025 | 0.223
0.173 | 0.344
0.420 | 0.520
0.002 | 0.064
| Plot | Mito | Lyso | Perox | ER | Golgi | PM | Cytosol | Nucleus | |||||
| Expt A |
5 peptides |
14 spectra |
|
0.000 0.000 | 0.000 |
0.000 0.000 | 0.000 |
0.000 0.000 | 0.000 |
0.081 0.000 | 0.186 |
0.138 0.025 | 0.223 |
0.271 0.173 | 0.344 |
0.477 0.420 | 0.520 |
0.034 0.002 | 0.064 |
| 1 spectrum, NVPLVIR | 0.000 | 0.000 | 0.000 | 0.000 | 0.000 | 0.588 | 0.412 | 0.000 | ||
| 2 spectra, VIHVISPQFR | 0.000 | 0.000 | 0.000 | 0.174 | 0.000 | 0.069 | 0.757 | 0.000 | ||
| 9 spectra, LIAHR | 0.000 | 0.000 | 0.000 | 0.132 | 0.307 | 0.211 | 0.129 | 0.221 | ||
| 1 spectrum, IDEETGVIETSDR | 0.000 | 0.005 | 0.000 | 0.000 | 0.000 | 0.468 | 0.527 | 0.000 | ||
| 1 spectrum, FSIEPK | 0.000 | 0.257 | 0.000 | 0.000 | 0.000 | 0.373 | 0.370 | 0.000 |
| Plot | Lyso | Other | |||||||||||
| Expt C |
7 peptides |
14 spectra |
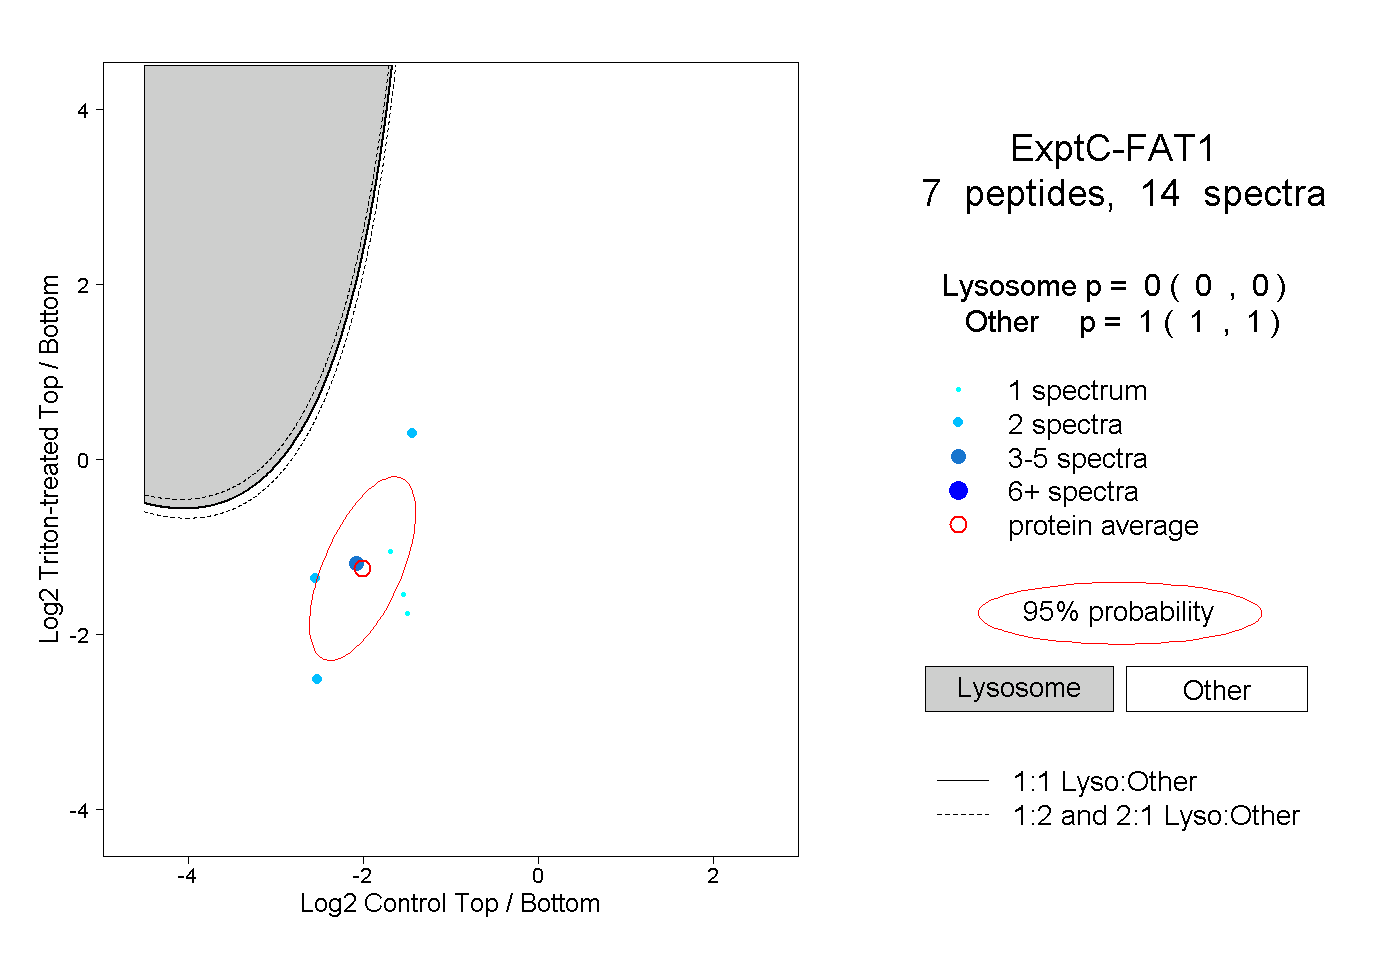 |
0.000 0.000 | 0.000 |
1.000 1.000 | 1.000 |