 13
13peptides
spectra
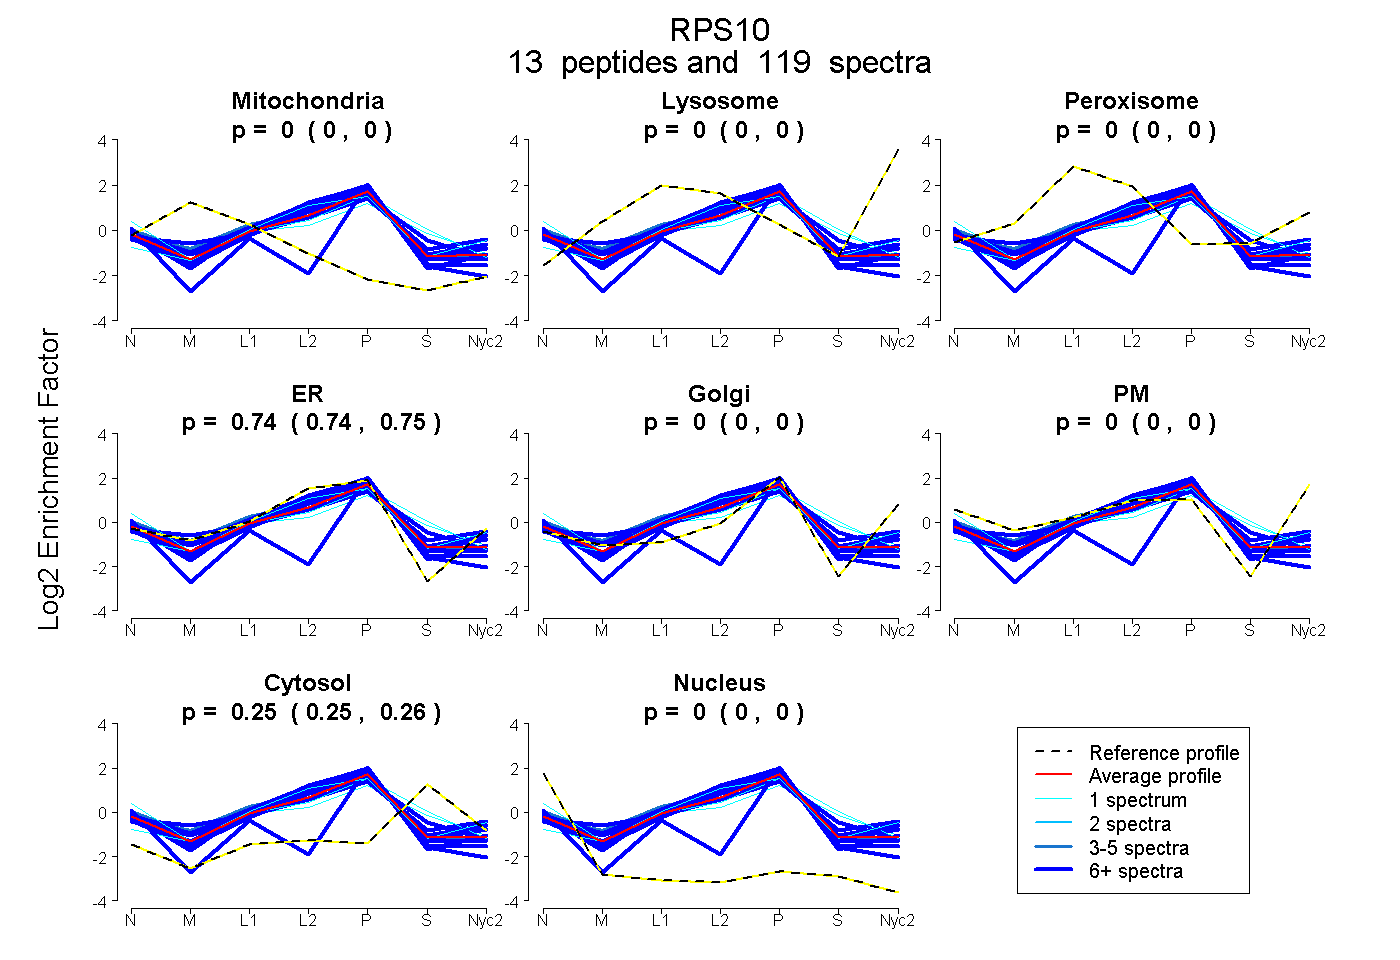
0.000 | 0.000
0.000 | 0.000
0.000 | 0.000
0.741 | 0.748
0.000 | 0.000
0.000 | 0.000
0.250 | 0.257
0.000 | 0.004
10peptides
spectra
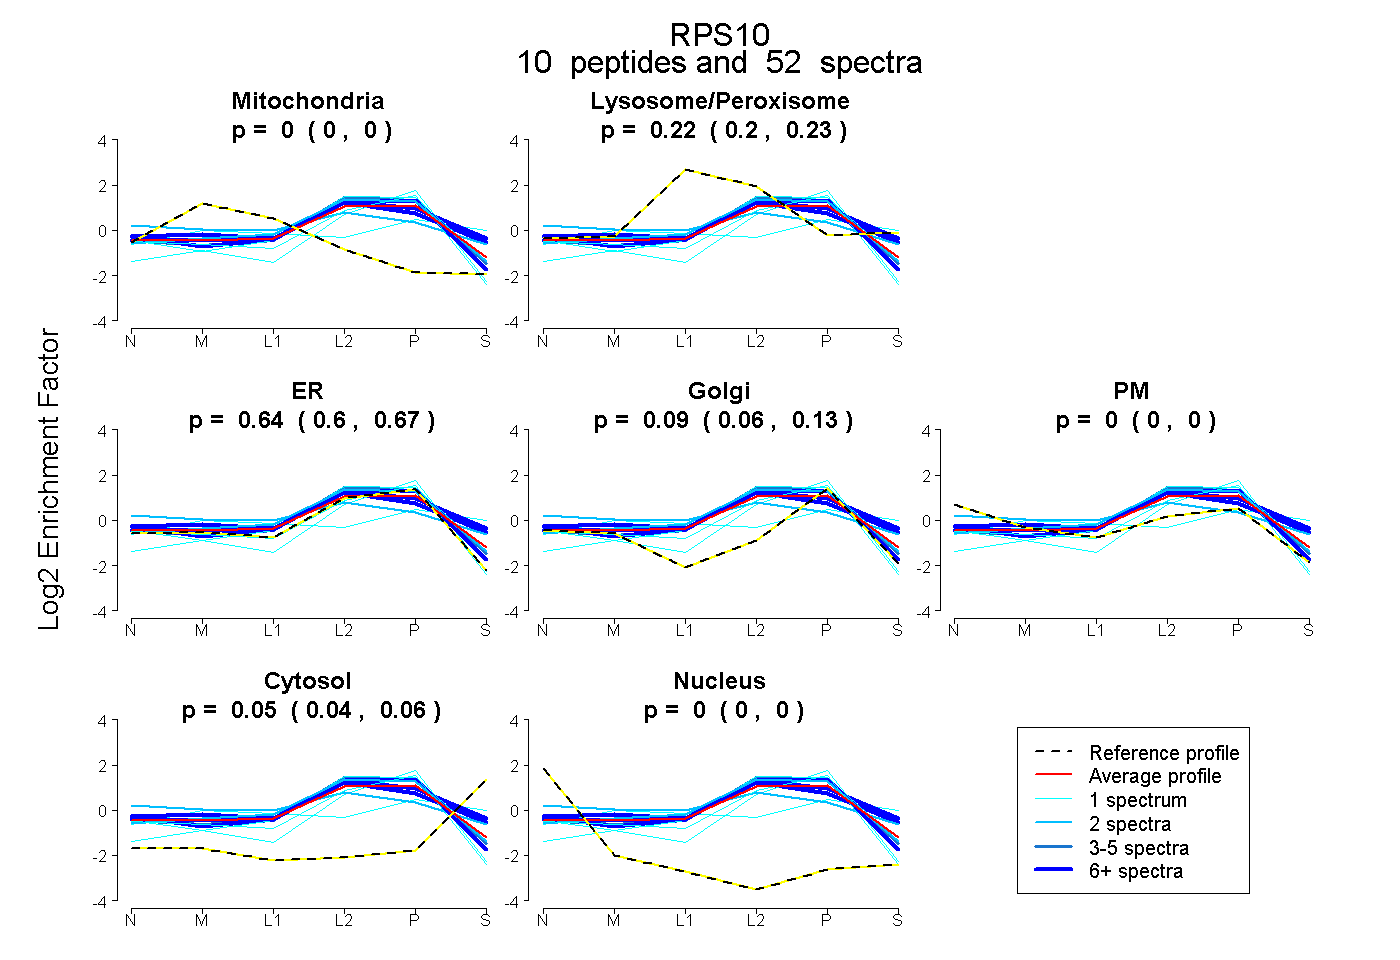
0.000 | 0.000
0.203 | 0.228
0.598 | 0.675
0.056 | 0.125
0.000 | 0.000
0.038 | 0.058
0.000 | 0.000
11peptides
spectra

0.000 | 0.000
1.000 | 1.000
5peptides
spectra
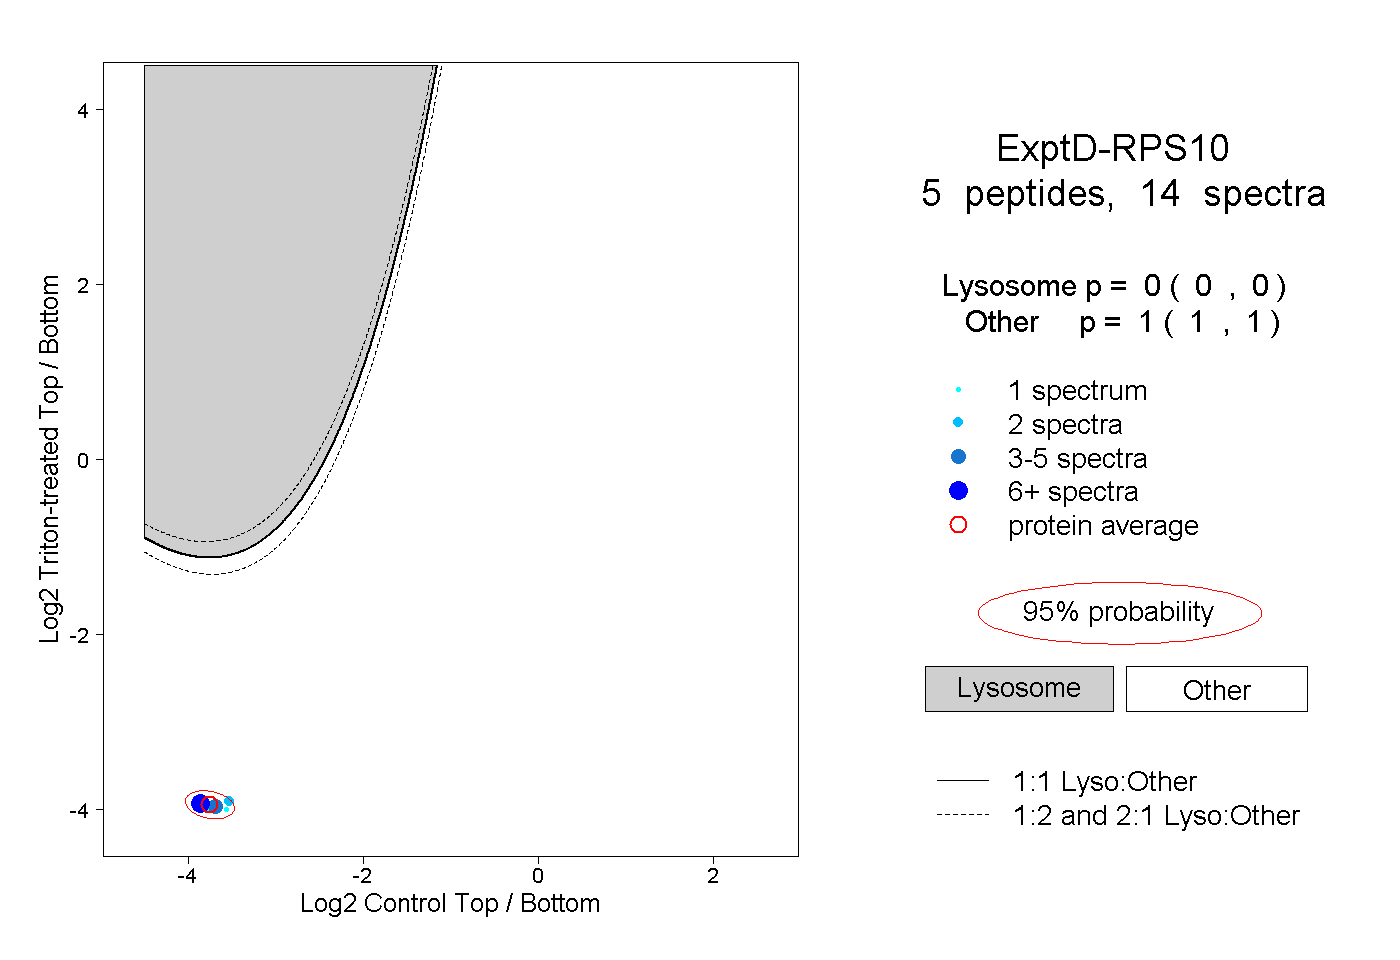
0.000 | 0.000
1.000 | 1.000