 4
4peptides
spectra
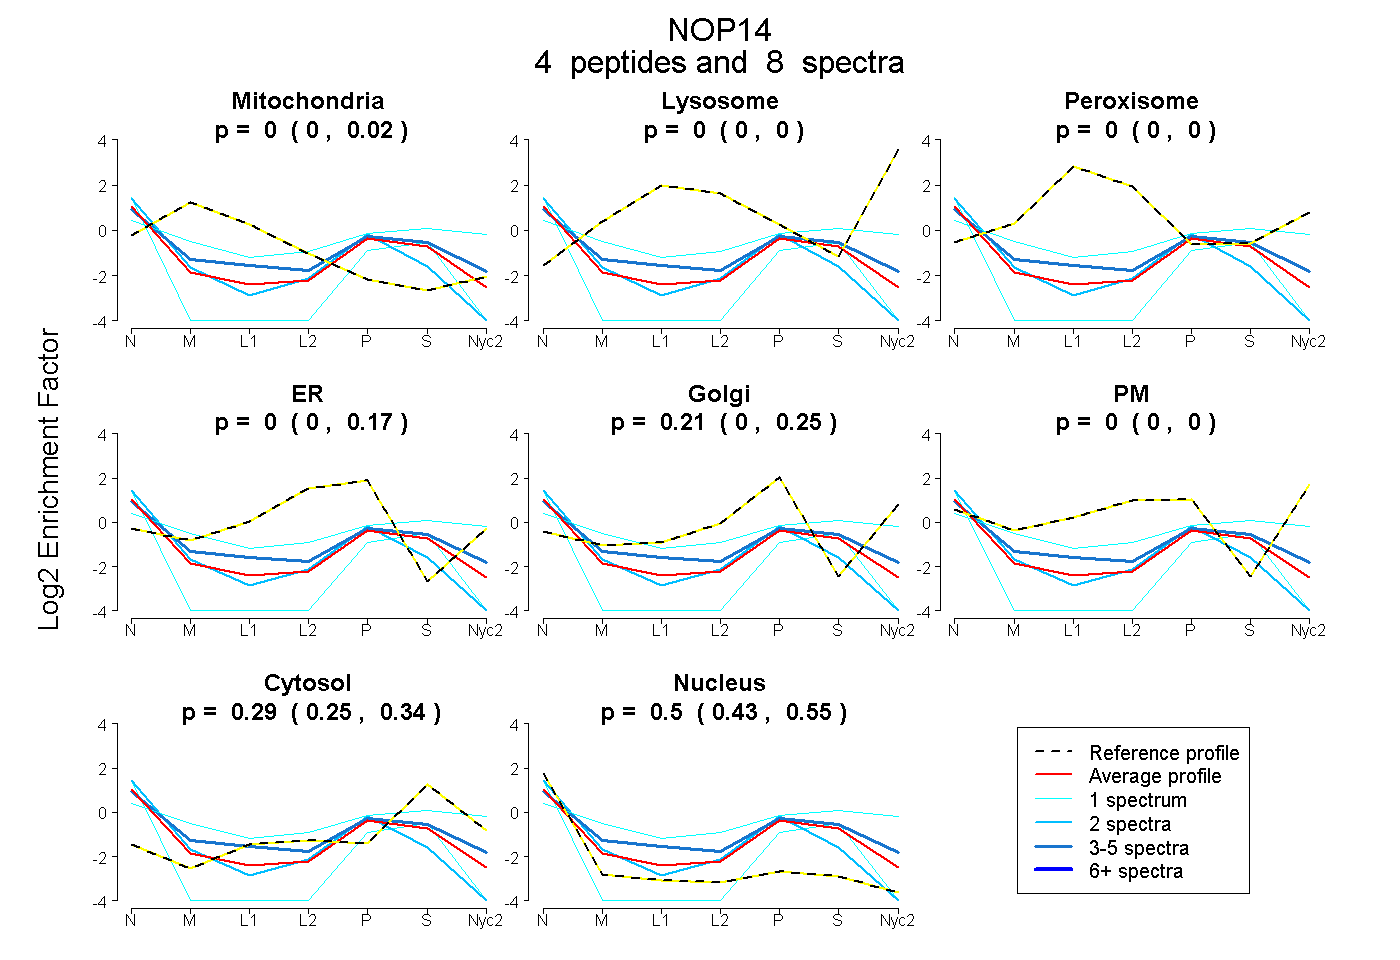
0.000 | 0.016
0.000 | 0.000
0.000 | 0.000
0.000 | 0.166
0.000 | 0.250
0.000 | 0.000
0.246 | 0.336
0.435 | 0.545
2peptides
spectra
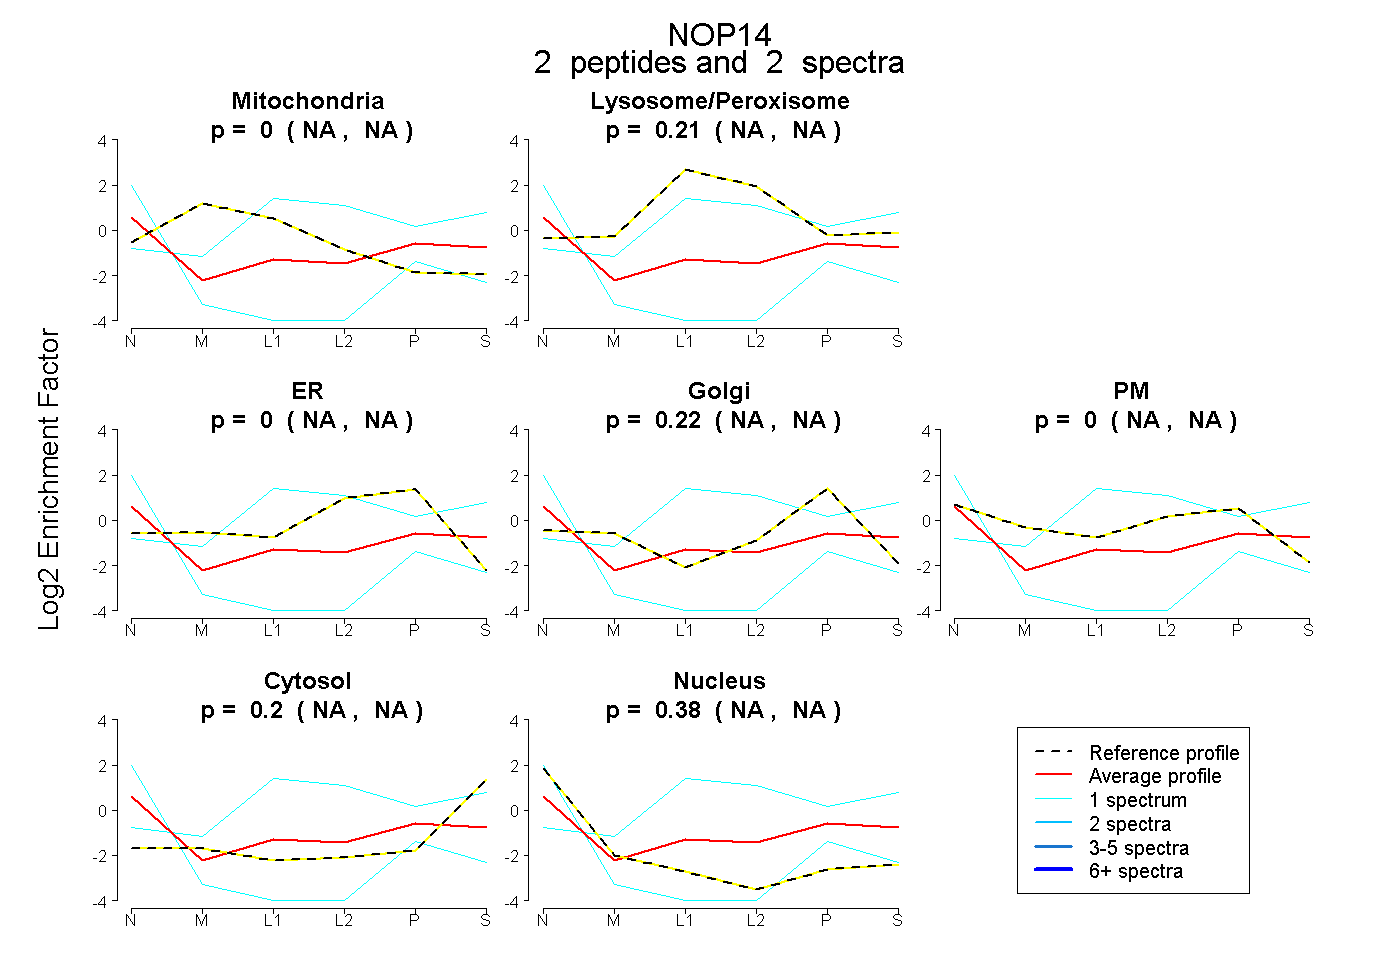
NA | NA
NA | NA
NA | NA
NA | NA
NA | NA
NA | NA
NA | NA
2peptides
spectra
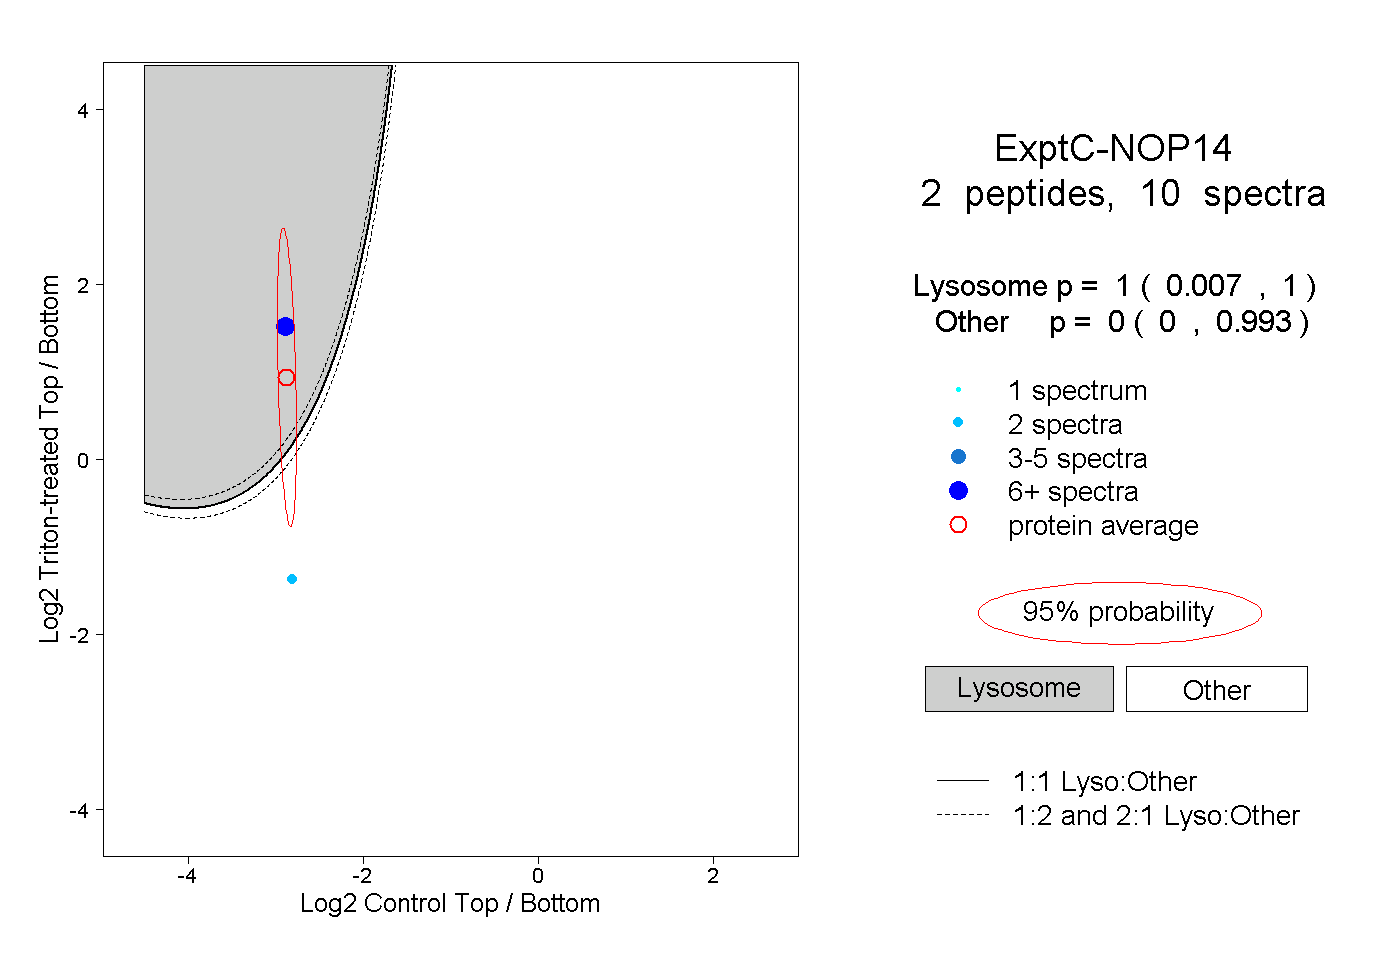
0.007 | 1.000
0.000 | 0.993