 4
4peptides
spectra
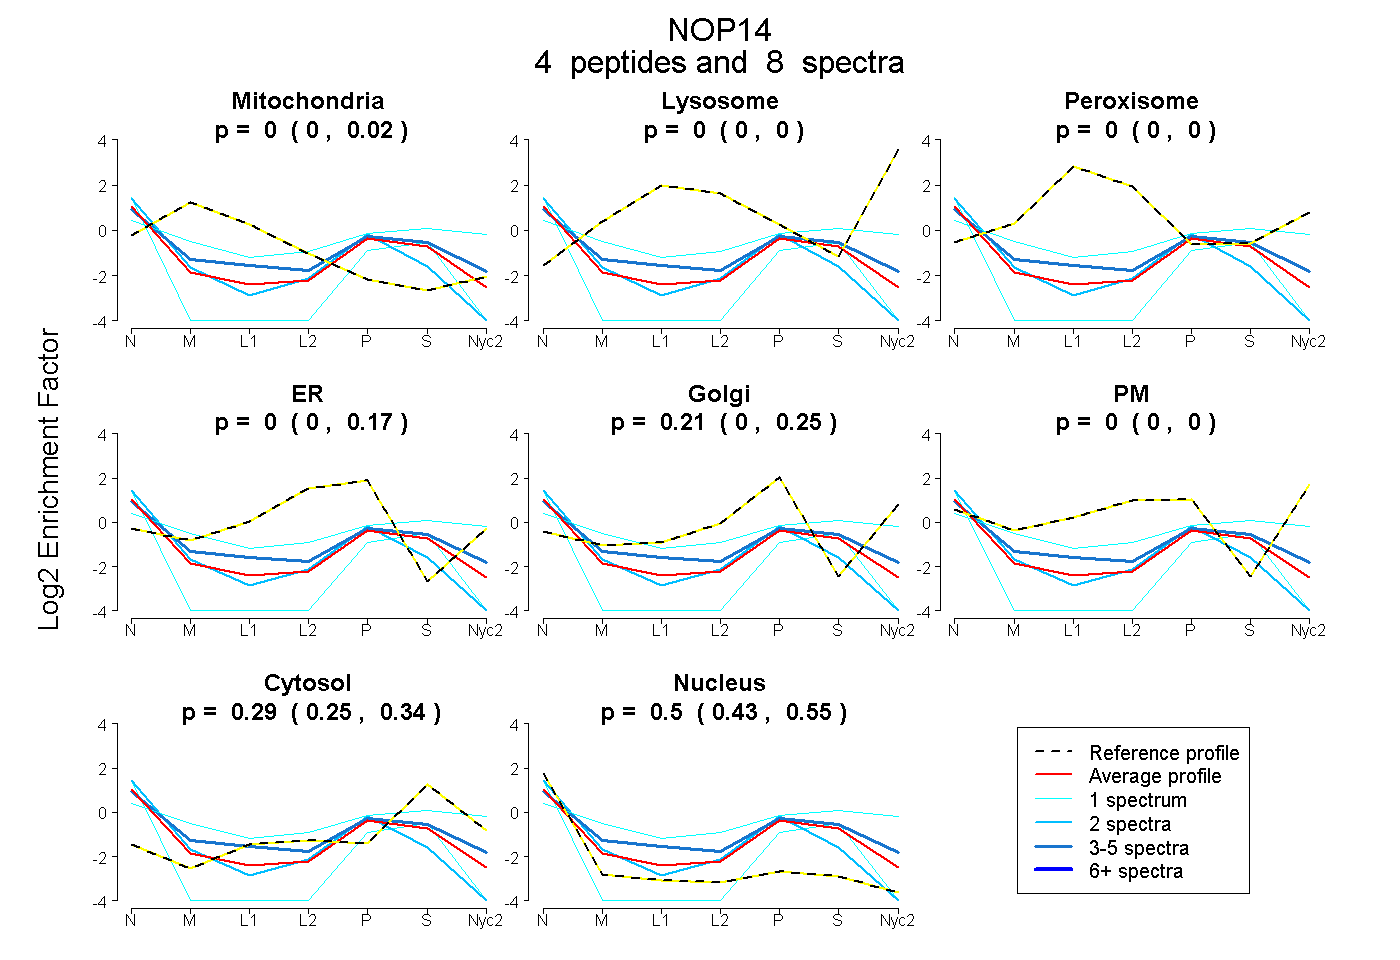
0.000 | 0.016
0.000 | 0.000
0.000 | 0.000
0.000 | 0.166
0.000 | 0.250
0.000 | 0.000
0.246 | 0.336
0.435 | 0.545
| Plot | Mito | Lyso | Perox | ER | Golgi | PM | Cytosol | Nucleus | |||||
| Expt A |
4 peptides |
8 spectra |
|
0.000 0.000 | 0.016 |
0.000 0.000 | 0.000 |
0.000 0.000 | 0.000 |
0.000 0.000 | 0.166 |
0.209 0.000 | 0.250 |
0.000 0.000 | 0.000 |
0.294 0.246 | 0.336 |
0.497 0.435 | 0.545 |
| 2 spectra, FLLSGR | 0.000 | 0.000 | 0.000 | 0.228 | 0.000 | 0.000 | 0.059 | 0.713 | ||
| 4 spectra, FQILGR | 0.060 | 0.000 | 0.040 | 0.000 | 0.251 | 0.000 | 0.309 | 0.340 | ||
| 1 spectrum, MNIEDAQEEQSK | 0.094 | 0.000 | 0.000 | 0.000 | 0.008 | 0.365 | 0.477 | 0.055 | ||
| 1 spectrum, ELIEELIAK | 0.000 | 0.000 | 0.000 | 0.000 | 0.000 | 0.000 | 0.200 | 0.800 |
| Plot | Mito | Lyso or Perox | ER | Golgi | PM | Cytosol | Nucleus | ||||||
| Expt B |
2 peptides |
2 spectra |
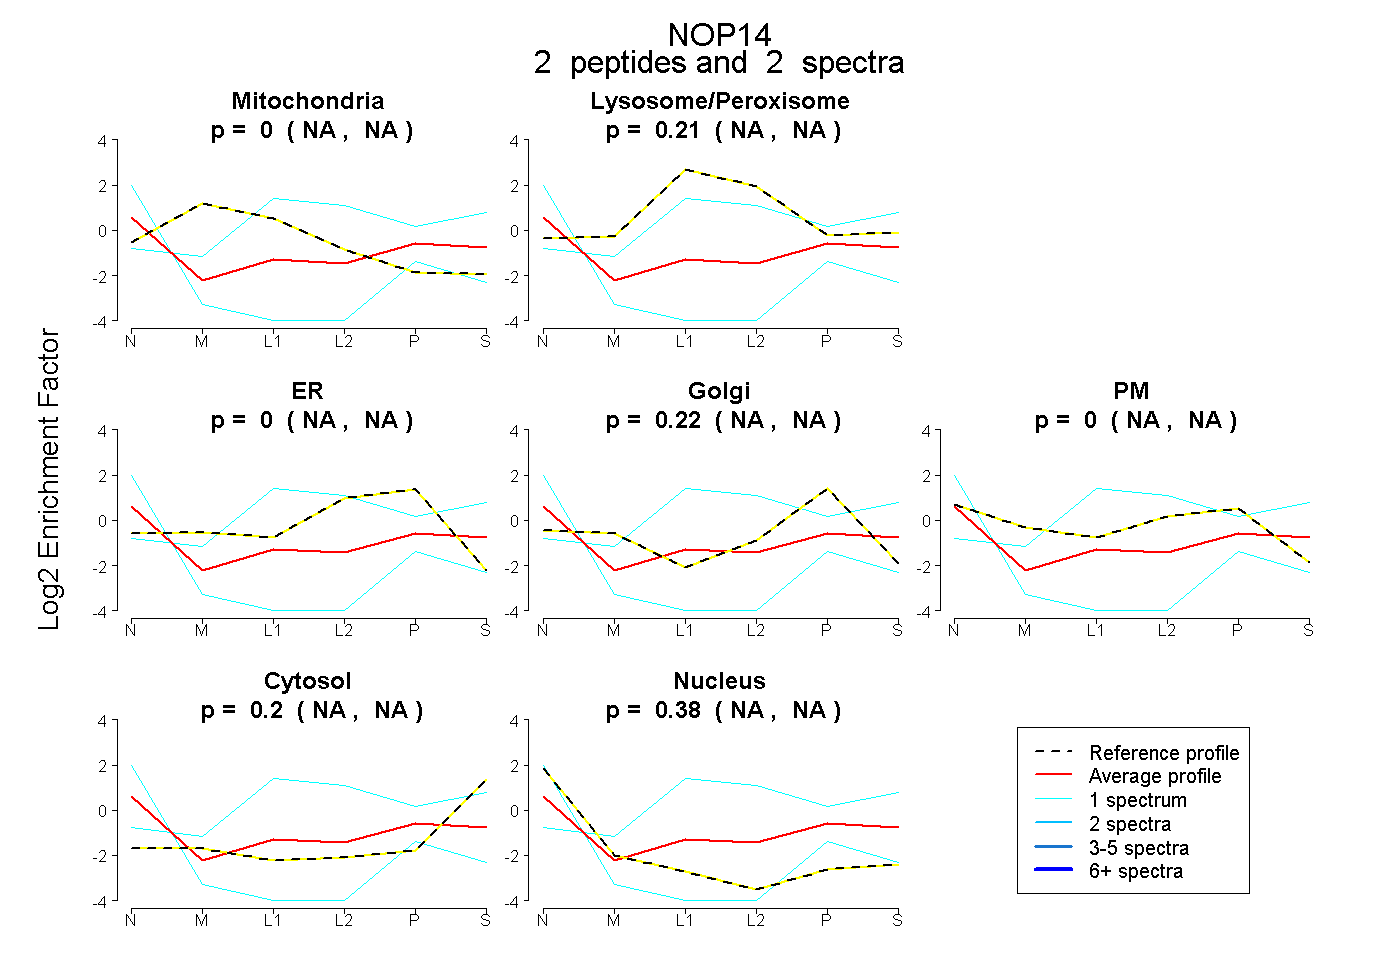 |
0.000 NA | NA |
0.209 NA | NA |
0.000 NA | NA |
0.218 NA | NA |
0.000 NA | NA |
0.196 NA | NA |
0.377 NA | NA |
|||
| Plot | Lyso | Other | |||||||||||
| Expt C |
2 peptides |
10 spectra |
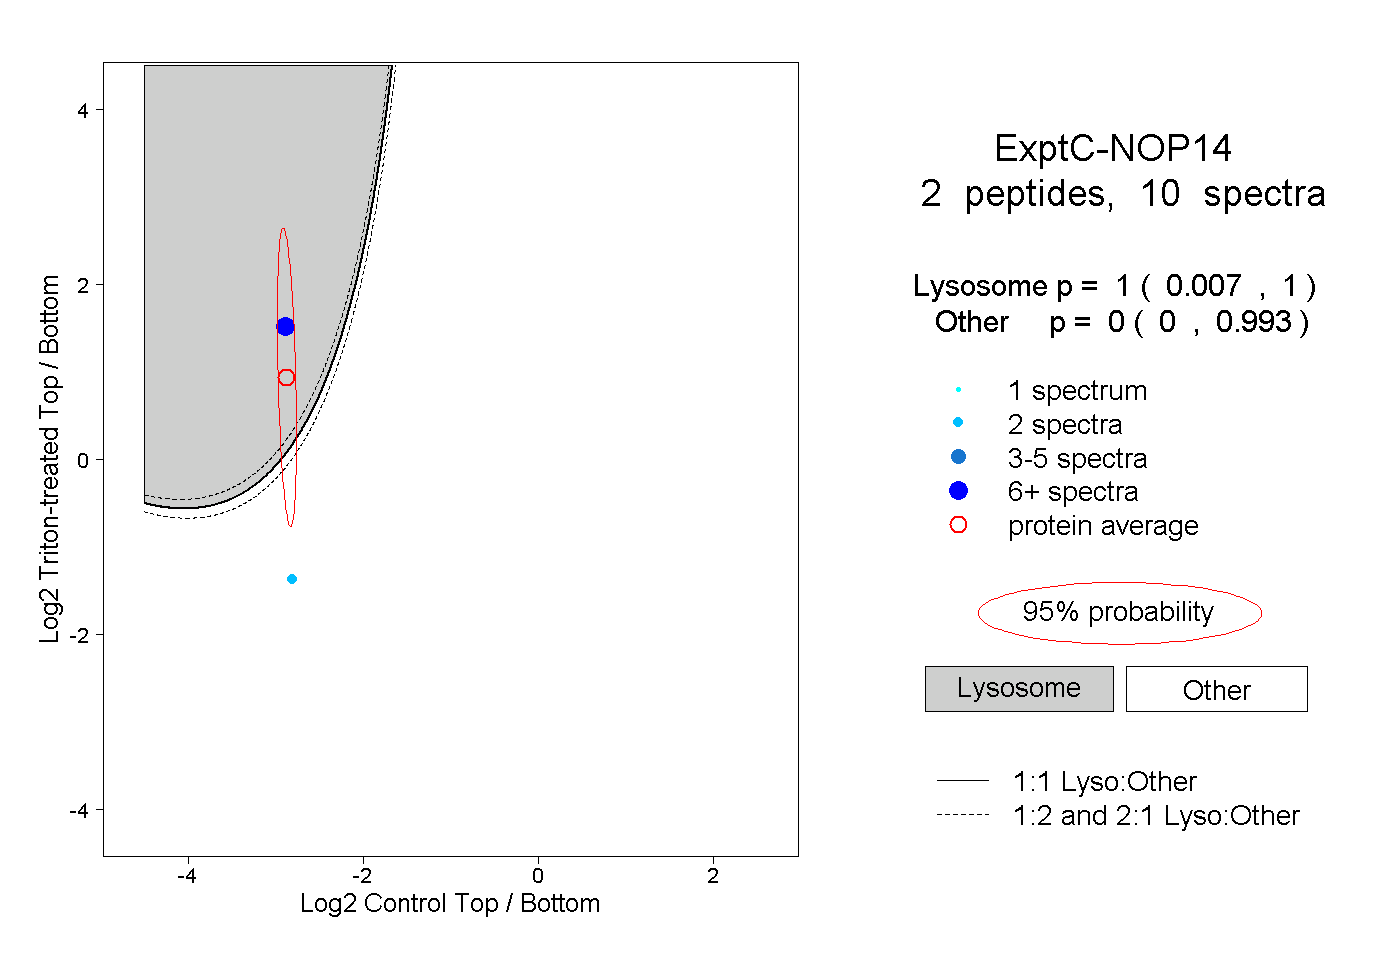 |
1.000 0.007 | 1.000 |
0.000 0.000 | 0.993 |