 3
3peptides
spectra
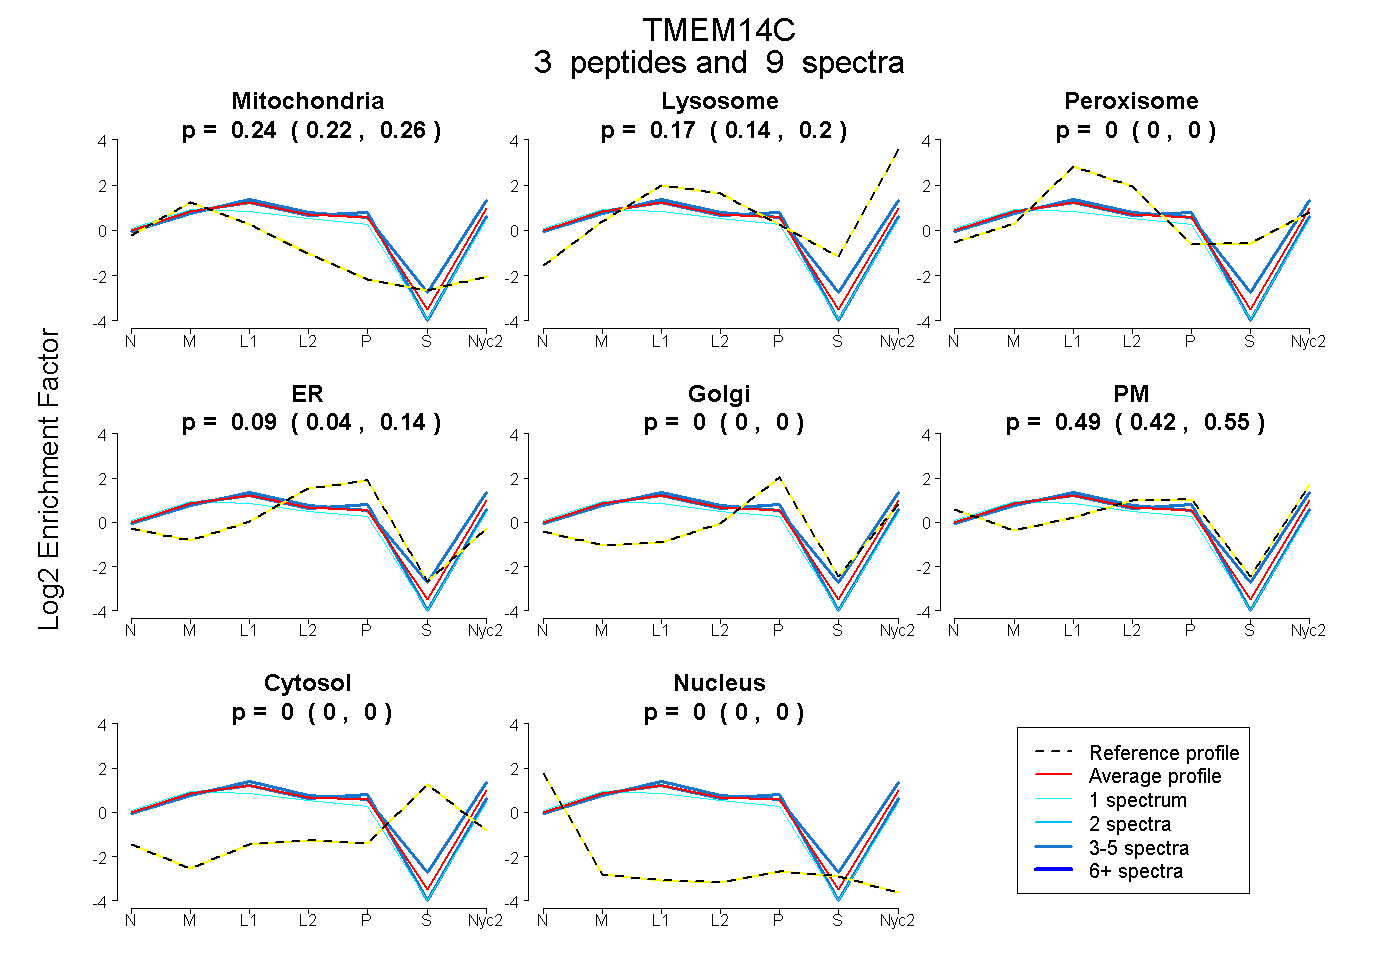
0.224 | 0.263
0.139 | 0.200
0.000 | 0.000
0.039 | 0.140
0.000 | 0.000
0.419 | 0.549
0.000 | 0.000
0.000 | 0.000
2peptides
spectra

0.144 | 0.416
0.000 | 0.387
0.000 | 0.598
0.000 | 0.425
0.000 | 0.000
0.000 | 0.032
0.000 | 0.000
3peptides
spectra
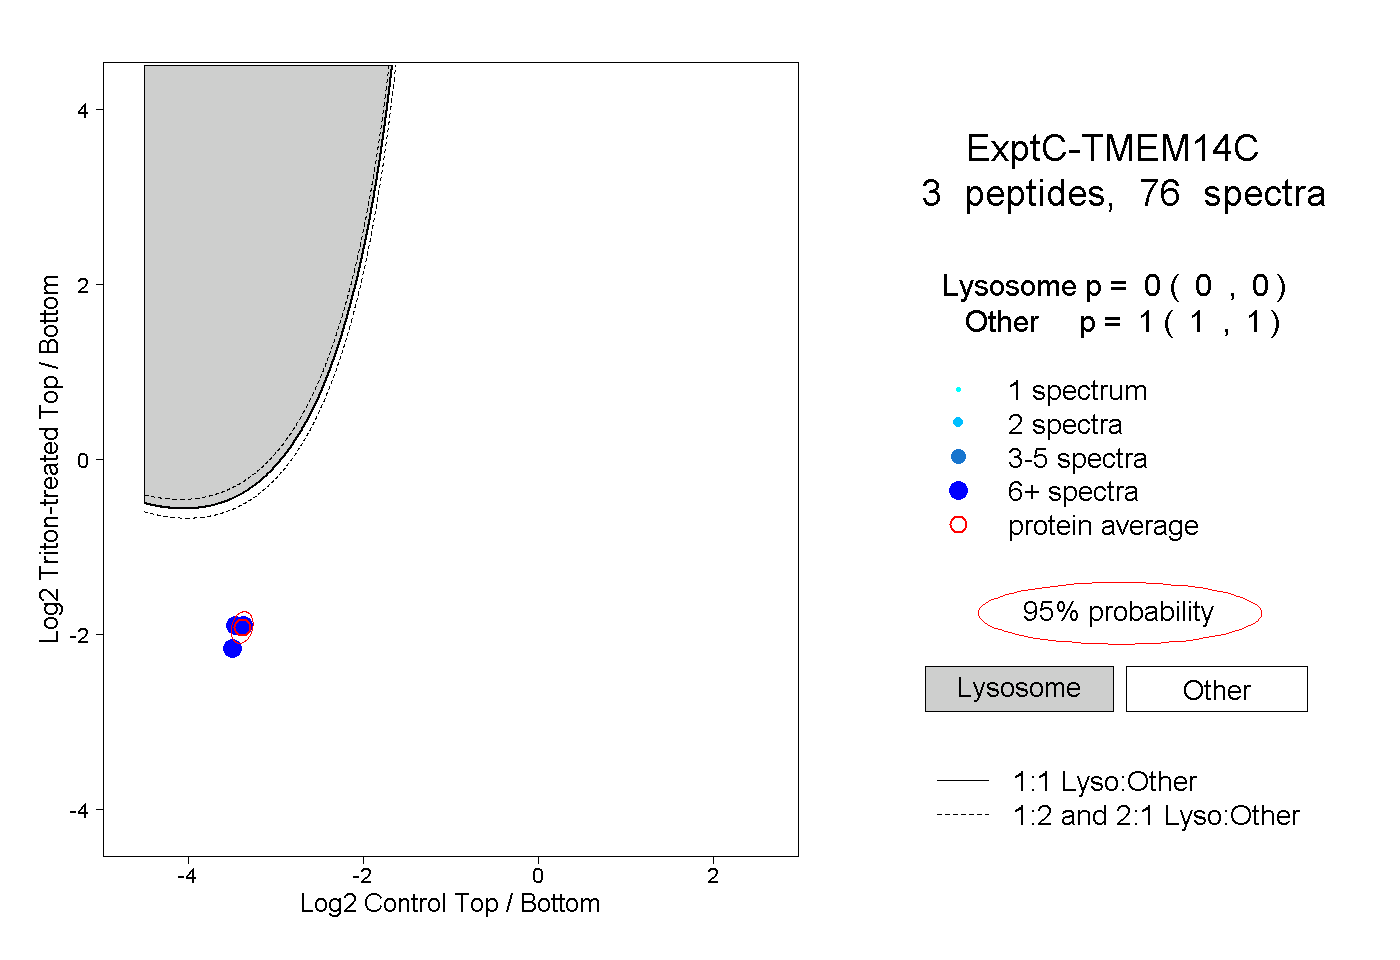
0.000 | 0.000
1.000 | 1.000
1peptide
spectrum

NA | NA
NA | NA