 3
3peptides
spectra
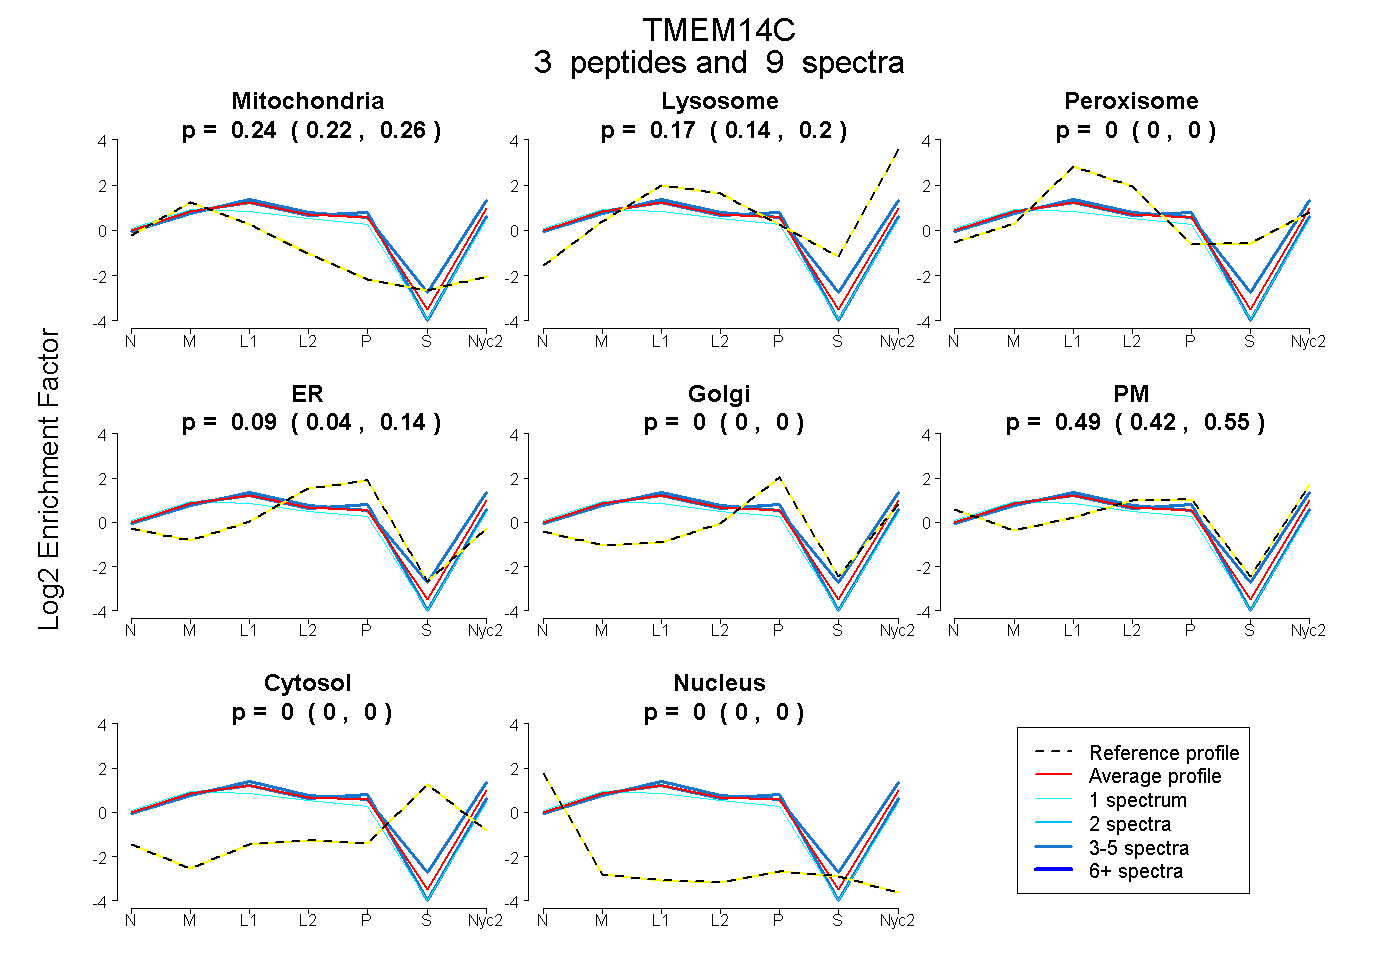
0.224 | 0.263
0.139 | 0.200
0.000 | 0.000
0.039 | 0.140
0.000 | 0.000
0.419 | 0.549
0.000 | 0.000
0.000 | 0.000
| Plot | Mito | Lyso | Perox | ER | Golgi | PM | Cytosol | Nucleus | |||||
| Expt A |
3 peptides |
9 spectra |
|
0.245 0.224 | 0.263 |
0.171 0.139 | 0.200 |
0.000 0.000 | 0.000 |
0.092 0.039 | 0.140 |
0.000 0.000 | 0.000 |
0.492 0.419 | 0.549 |
0.000 0.000 | 0.000 |
0.000 0.000 | 0.000 |
| 1 spectrum, FYNSGK | 0.338 | 0.025 | 0.000 | 0.077 | 0.000 | 0.560 | 0.000 | 0.000 | ||
| 5 spectra, LGLSMLSSPHP | 0.194 | 0.256 | 0.037 | 0.024 | 0.000 | 0.489 | 0.000 | 0.000 | ||
| 3 spectra, FMPAGLIAGASLLMVAK | 0.250 | 0.095 | 0.000 | 0.222 | 0.000 | 0.432 | 0.000 | 0.000 |
| Plot | Mito | Lyso or Perox | ER | Golgi | PM | Cytosol | Nucleus | ||||||
| Expt B |
2 peptides |
4 spectra |
 |
0.309 0.144 | 0.416 |
0.187 0.000 | 0.387 |
0.328 0.000 | 0.598 |
0.175 0.000 | 0.425 |
0.000 0.000 | 0.000 |
0.000 0.000 | 0.032 |
0.000 0.000 | 0.000 |
|||
| Plot | Lyso | Other | |||||||||||
| Expt C |
3 peptides |
76 spectra |
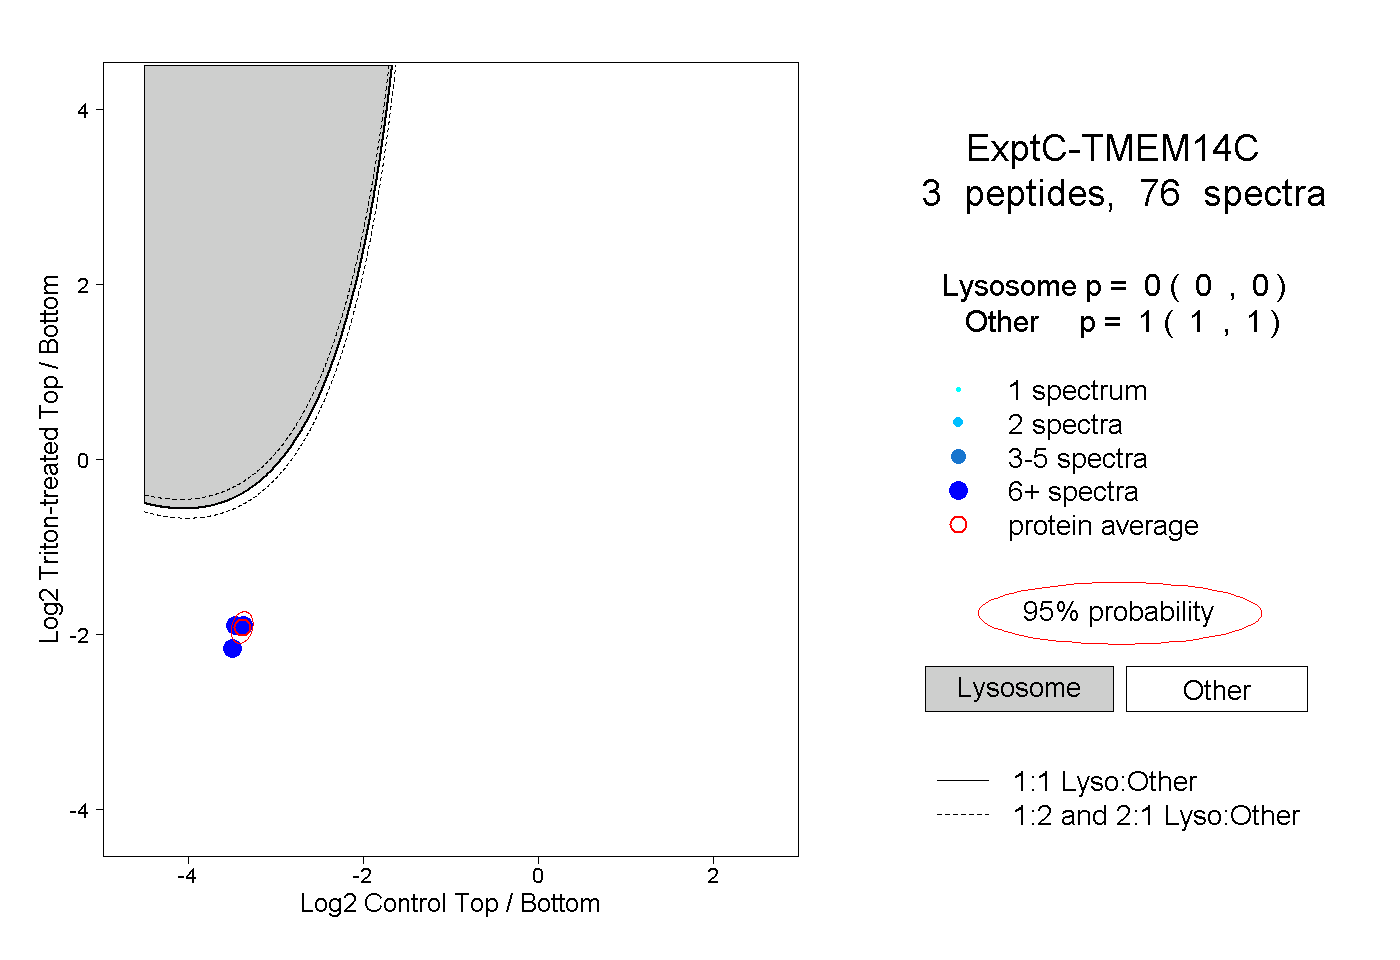 |
0.000 0.000 | 0.000 |
1.000 1.000 | 1.000 |
||||||||
| Plot | Lyso | Other | |||||||||||
| Expt D |
1 peptide |
1 spectrum |
 |
0.000 NA | NA |
1.000 NA | NA |