 12
12peptides
spectra
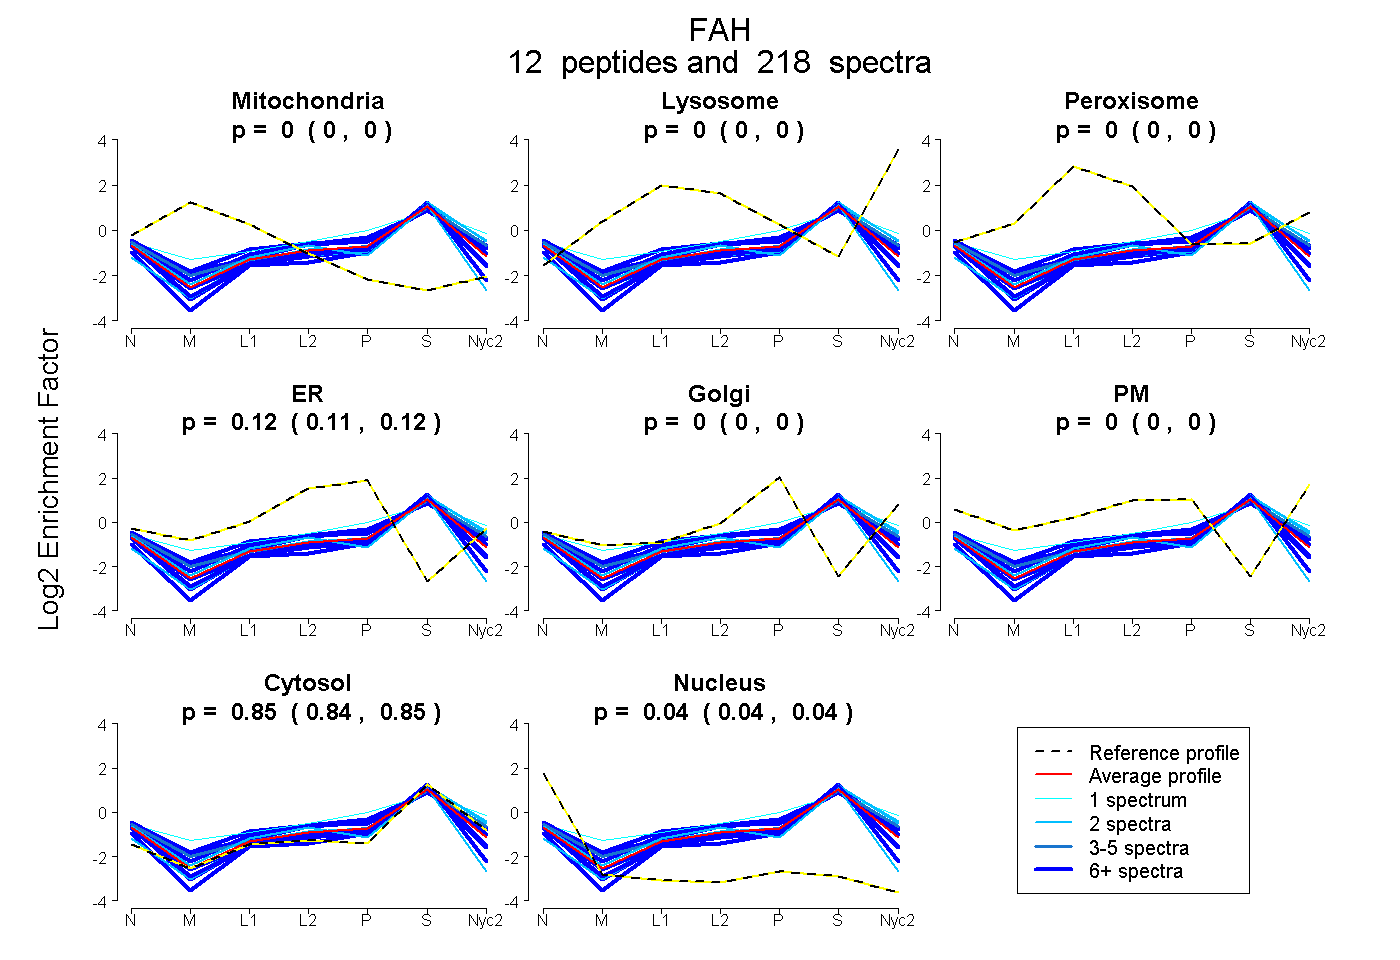
0.000 | 0.000
0.000 | 0.000
0.000 | 0.000
0.114 | 0.118
0.000 | 0.000
0.000 | 0.000
0.843 | 0.847
0.037 | 0.041
11peptides
spectra
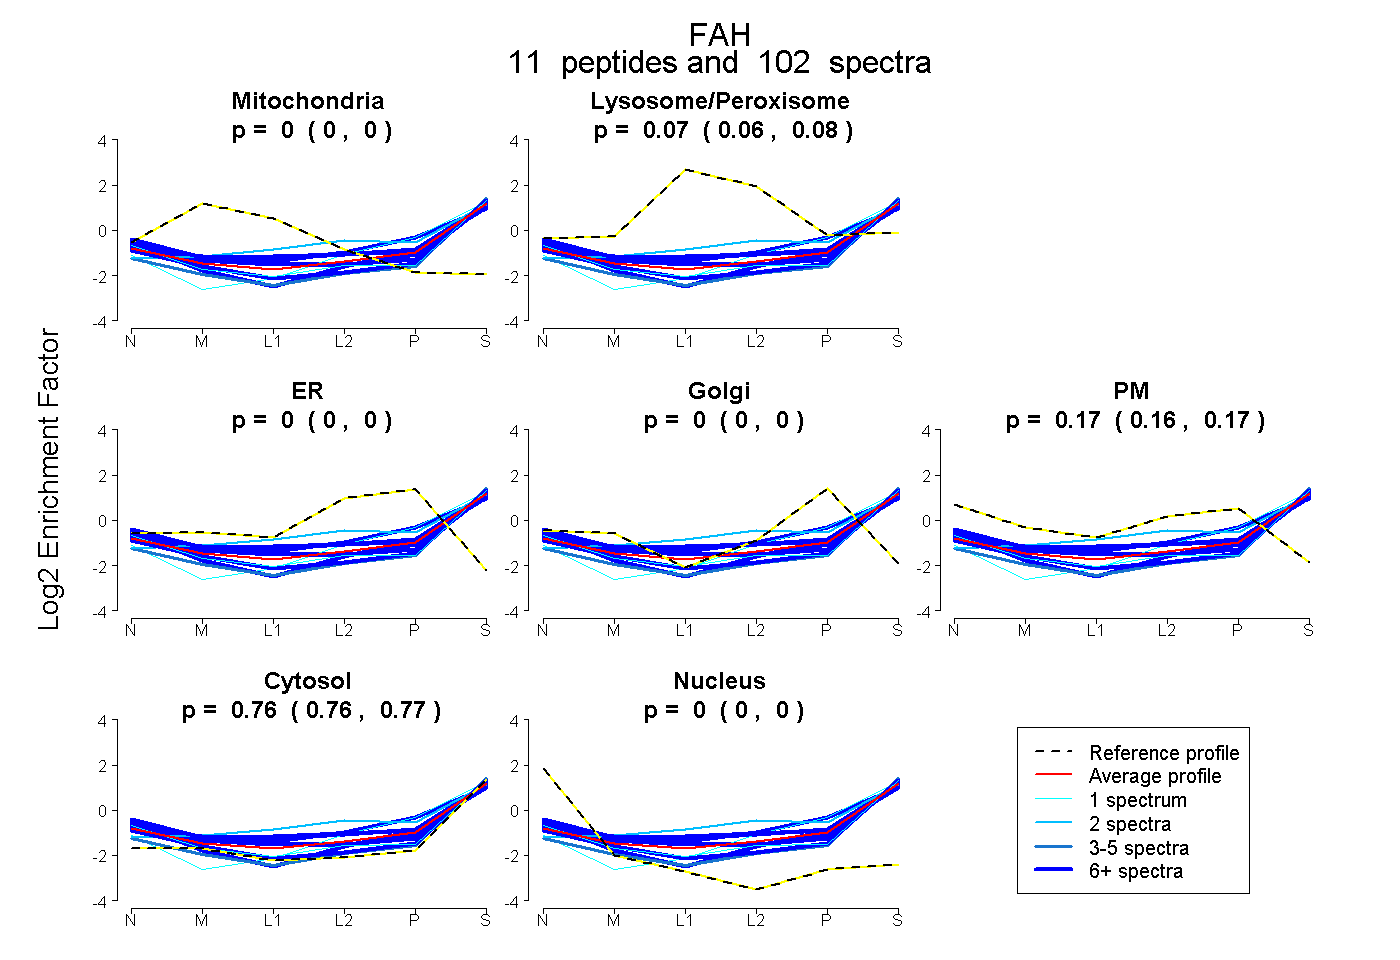
0.000 | 0.000
0.065 | 0.077
0.000 | 0.000
0.000 | 0.000
0.161 | 0.170
0.759 | 0.766
0.000 | 0.000
11peptides
spectra
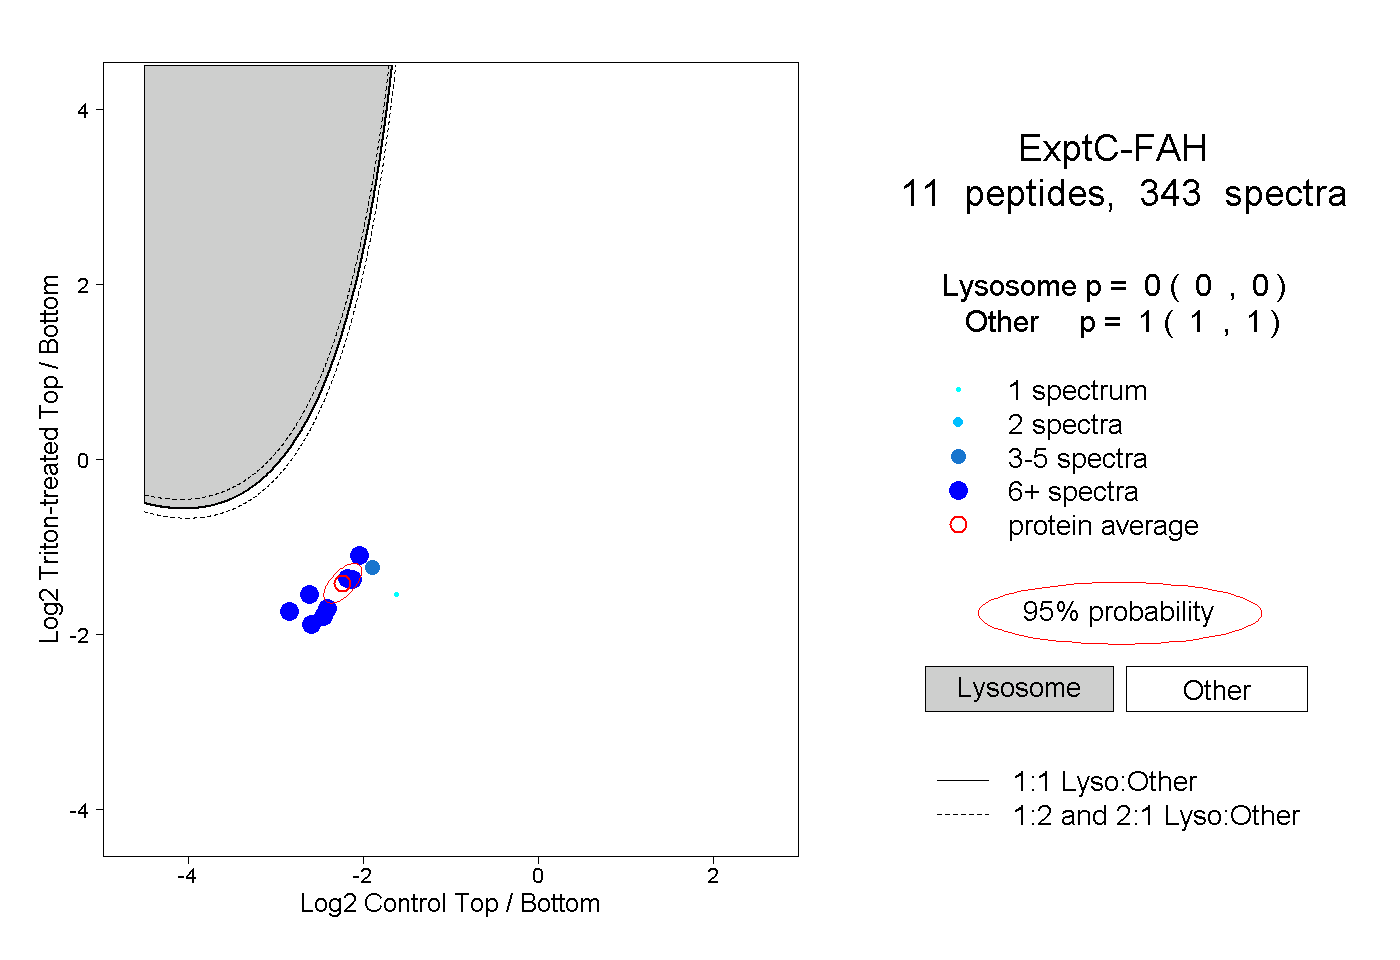
0.000 | 0.000
1.000 | 1.000
6peptides
spectra
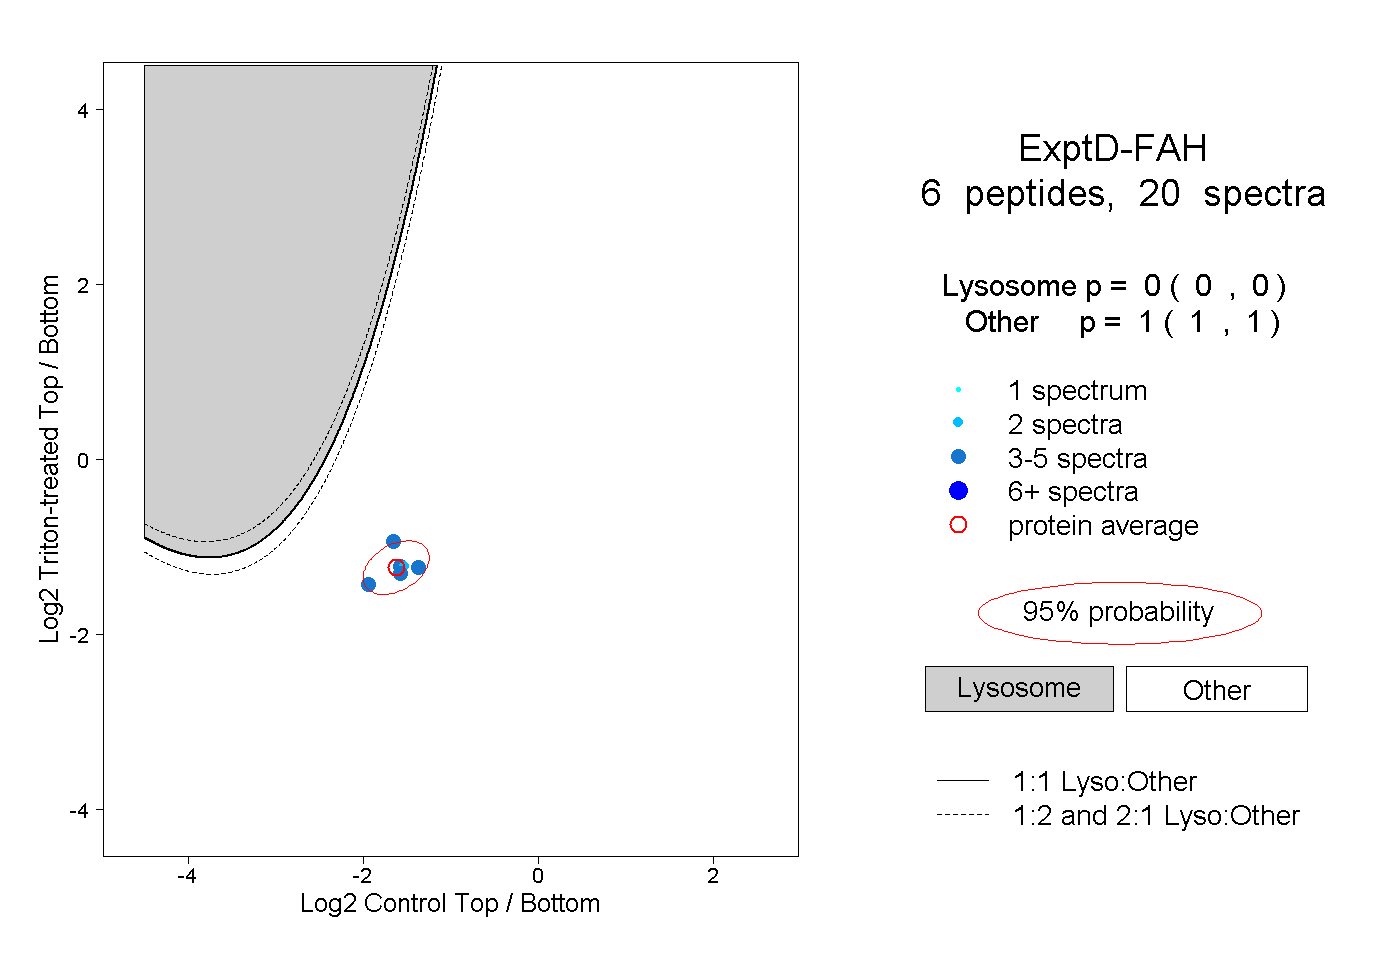
0.000 | 0.000
1.000 | 1.000