 12
12peptides
spectra
0.000 | 0.000
0.000 | 0.000
0.000 | 0.000
0.114 | 0.118
0.000 | 0.000
0.000 | 0.000
0.843 | 0.847
0.037 | 0.041
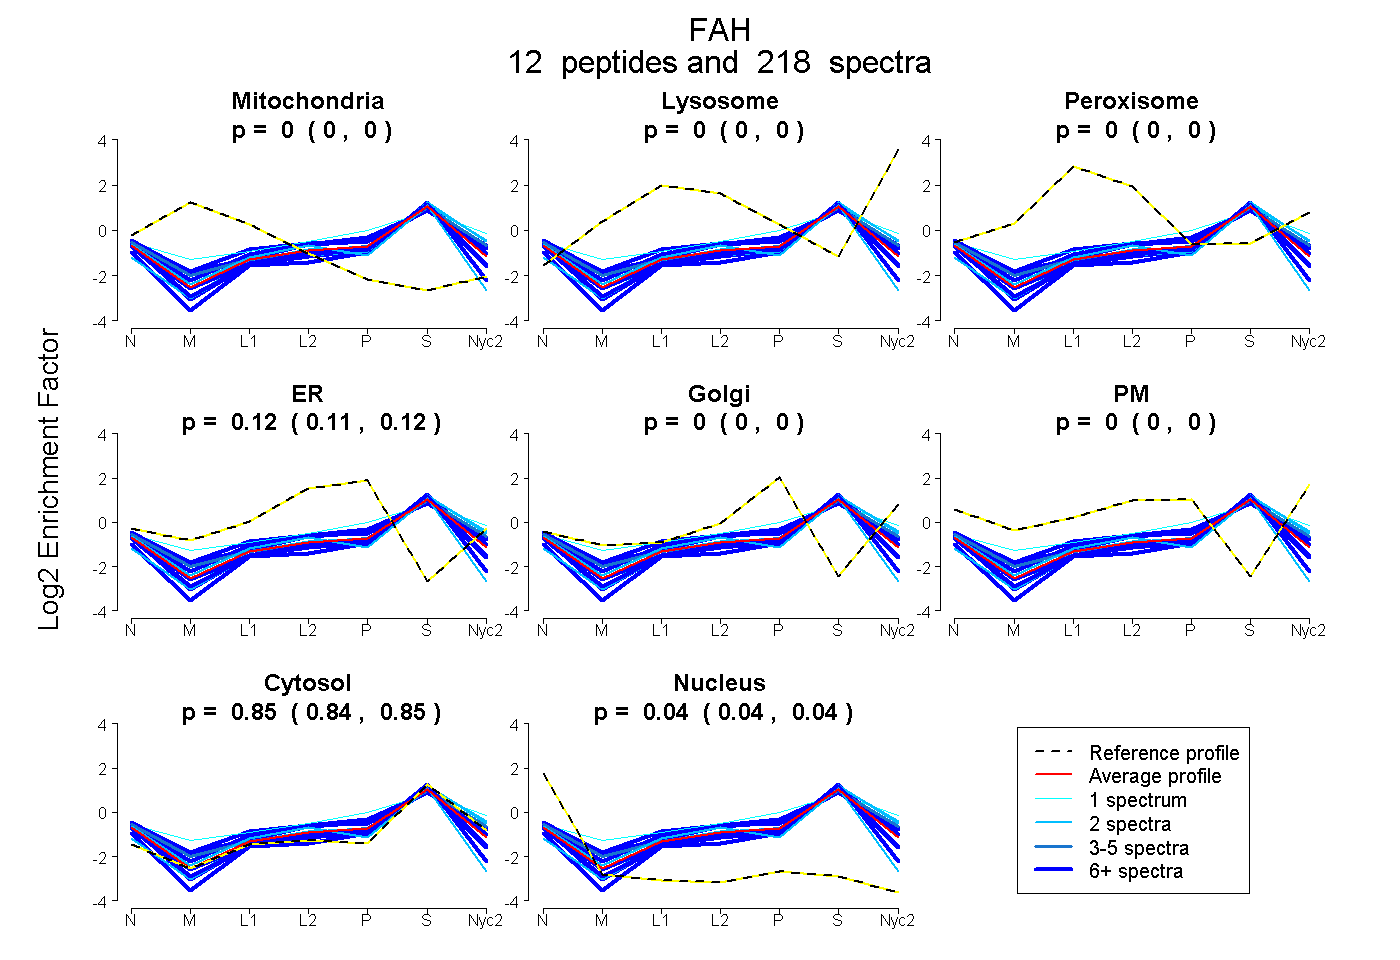
| Plot | Mito | Lyso | Perox | ER | Golgi | PM | Cytosol | Nucleus | |||||
| Expt A |
12 peptides |
218 spectra |
|
0.000 0.000 | 0.000 |
0.000 0.000 | 0.000 |
0.000 0.000 | 0.000 |
0.116 0.114 | 0.118 |
0.000 0.000 | 0.000 |
0.000 0.000 | 0.000 |
0.845 0.843 | 0.847 |
0.039 0.037 | 0.041 |
| 2 spectra, FGEPIPISK | 0.000 | 0.000 | 0.000 | 0.000 | 0.034 | 0.078 | 0.888 | 0.000 | ||
| 47 spectra, GEGMSQAATICR | 0.000 | 0.000 | 0.000 | 0.000 | 0.000 | 0.000 | 0.872 | 0.128 | ||
| 27 spectra, AQEHIFGMVLMNDWSAR | 0.000 | 0.000 | 0.086 | 0.132 | 0.000 | 0.033 | 0.733 | 0.016 | ||
| 1 spectrum, DIQQWEYVPLGPFLGK | 0.000 | 0.000 | 0.097 | 0.000 | 0.142 | 0.129 | 0.632 | 0.000 | ||
| 2 spectra, VLPALSPA | 0.000 | 0.000 | 0.044 | 0.036 | 0.000 | 0.000 | 0.768 | 0.153 | ||
| 28 spectra, VGFGQCAGK | 0.000 | 0.000 | 0.000 | 0.044 | 0.000 | 0.000 | 0.872 | 0.083 | ||
| 51 spectra, AIDVGQGQTR | 0.000 | 0.000 | 0.000 | 0.047 | 0.000 | 0.000 | 0.894 | 0.058 | ||
| 11 spectra, ASLQNLLSASQAQLR | 0.000 | 0.000 | 0.000 | 0.168 | 0.000 | 0.056 | 0.776 | 0.000 | ||
| 4 spectra, IGVAIGDQILDLSVIK | 0.000 | 0.000 | 0.000 | 0.000 | 0.000 | 0.162 | 0.816 | 0.022 | ||
| 15 spectra, HLFTGPVLSK | 0.000 | 0.000 | 0.000 | 0.104 | 0.000 | 0.121 | 0.772 | 0.004 | ||
| 28 spectra, TFLLDGDEVIITGHCQGDGYR | 0.000 | 0.000 | 0.000 | 0.079 | 0.000 | 0.000 | 0.841 | 0.081 | ||
| 2 spectra, LDMELEMAFFVGPGNR | 0.000 | 0.000 | 0.000 | 0.000 | 0.058 | 0.000 | 0.942 | 0.000 |
| Plot | Mito | Lyso or Perox | ER | Golgi | PM | Cytosol | Nucleus | ||||||
| Expt B |
11 peptides |
102 spectra |
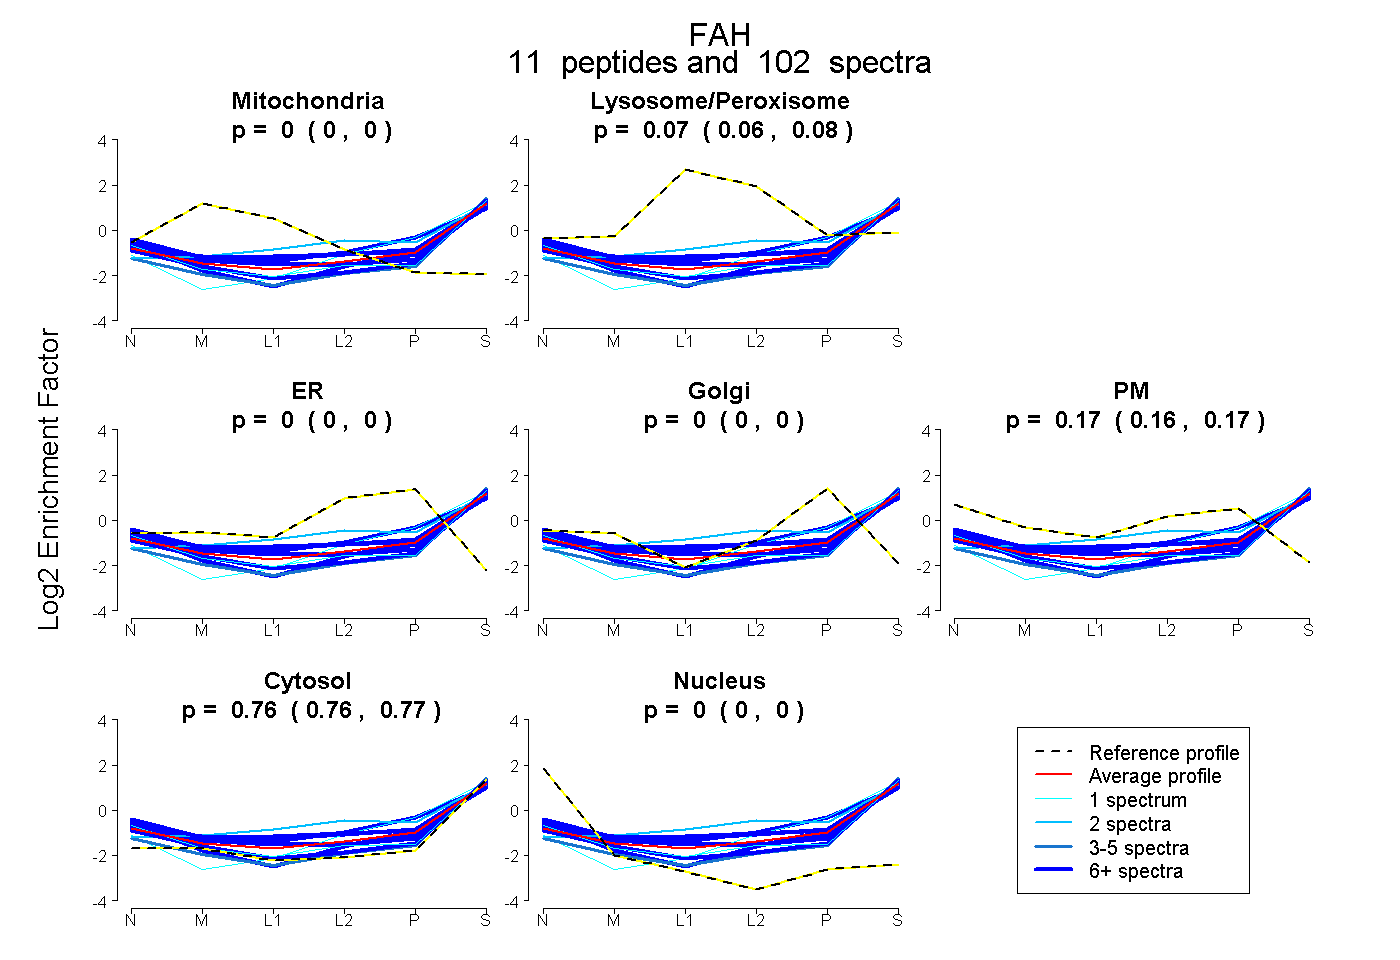 |
0.000 0.000 | 0.000 |
0.071 0.065 | 0.077 |
0.000 0.000 | 0.000 |
0.000 0.000 | 0.000 |
0.166 0.161 | 0.170 |
0.763 0.759 | 0.766 |
0.000 0.000 | 0.000 |
|||
| Plot | Lyso | Other | |||||||||||
| Expt C |
11 peptides |
343 spectra |
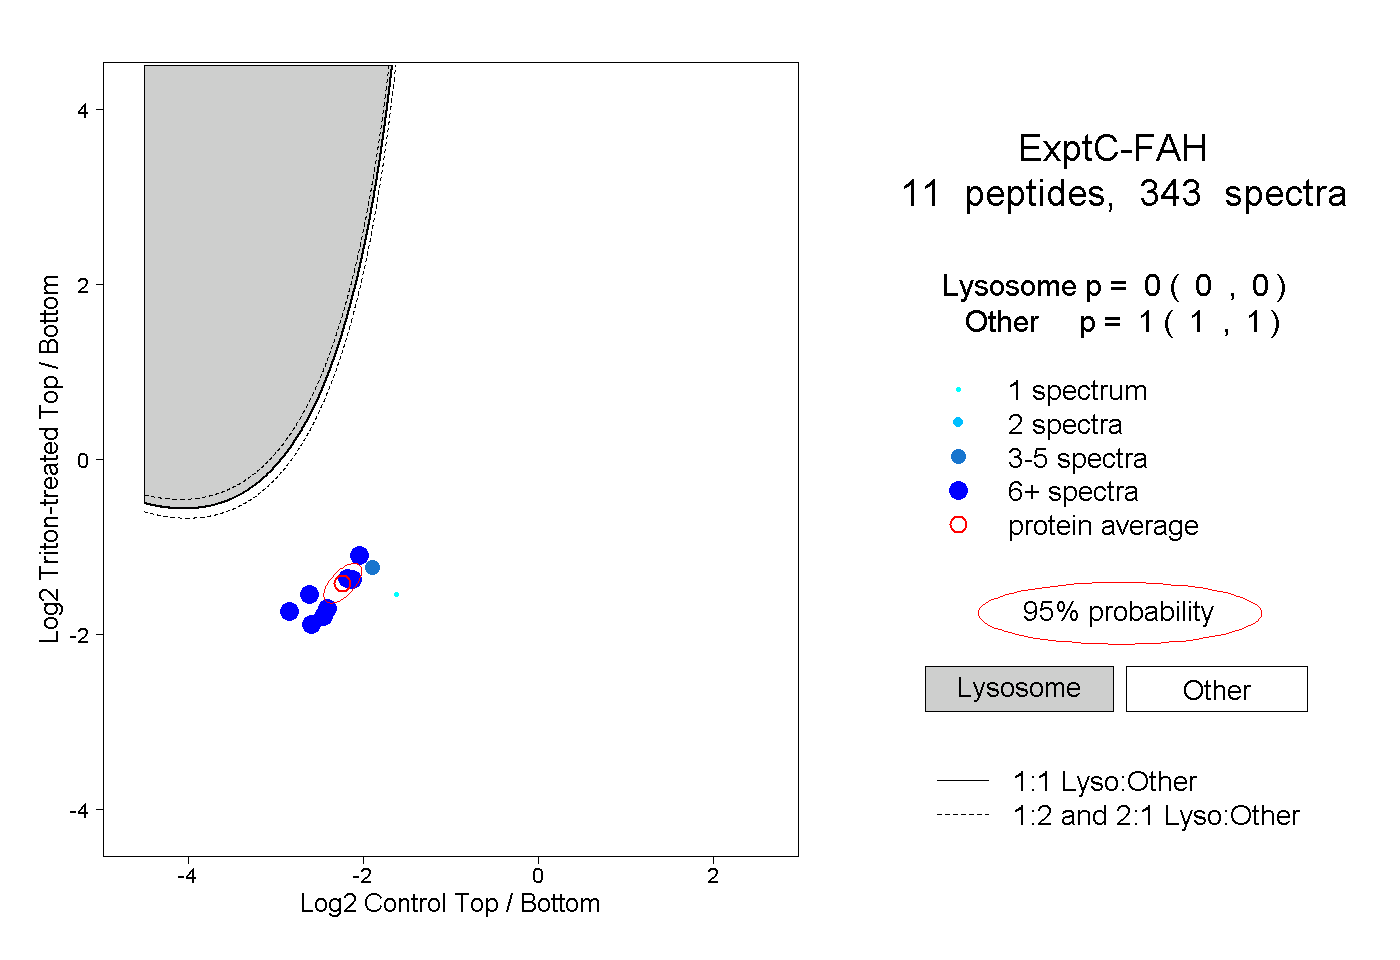 |
0.000 0.000 | 0.000 |
1.000 1.000 | 1.000 |
||||||||
| Plot | Lyso | Other | |||||||||||
| Expt D |
6 peptides |
20 spectra |
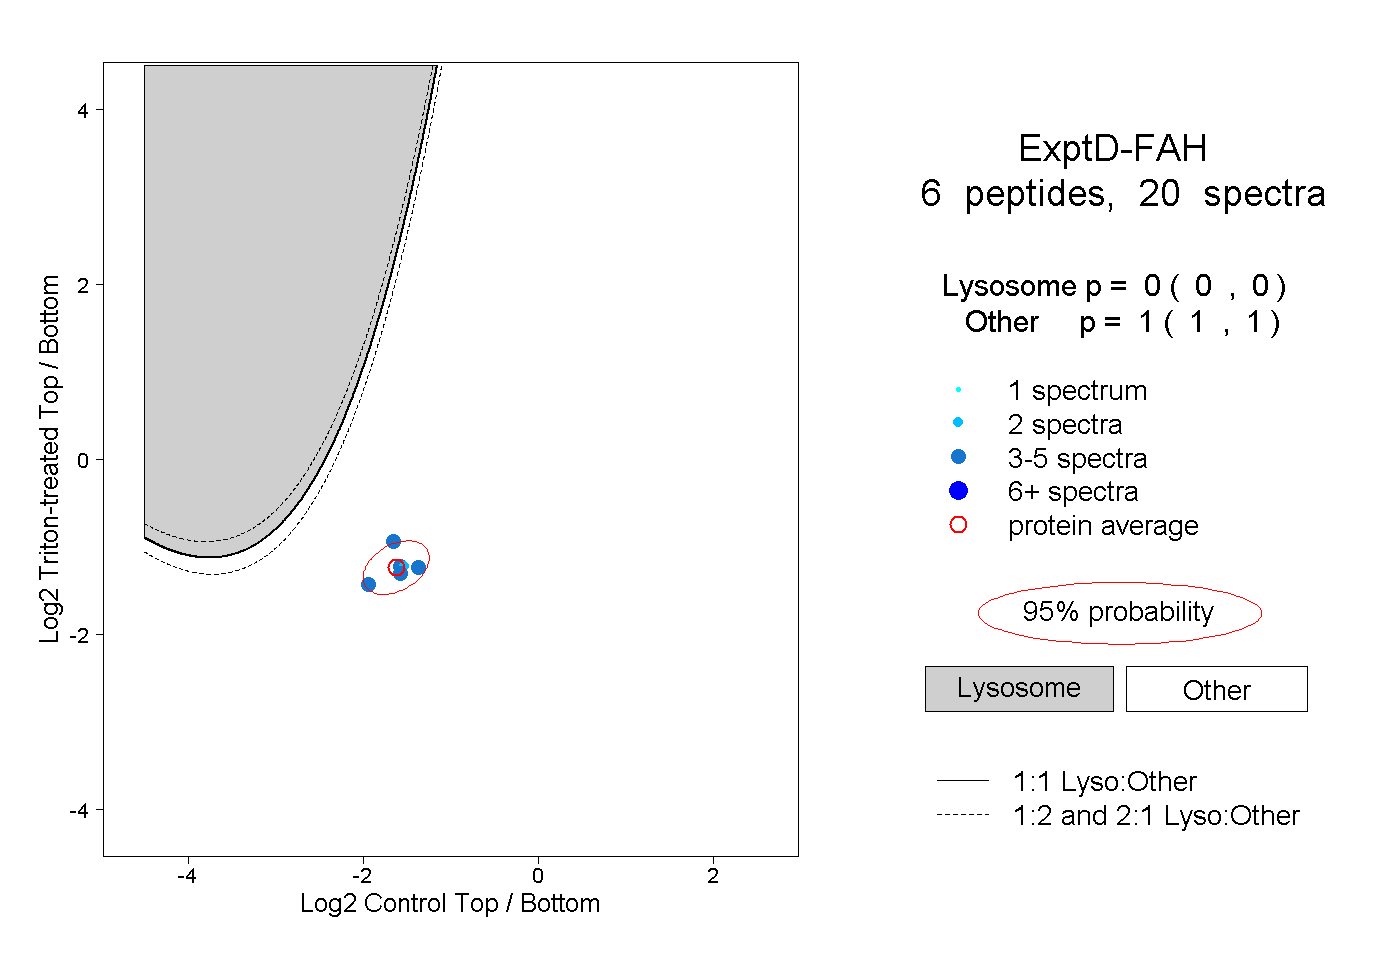 |
0.000 0.000 | 0.000 |
1.000 1.000 | 1.000 |