 24
24peptides
spectra
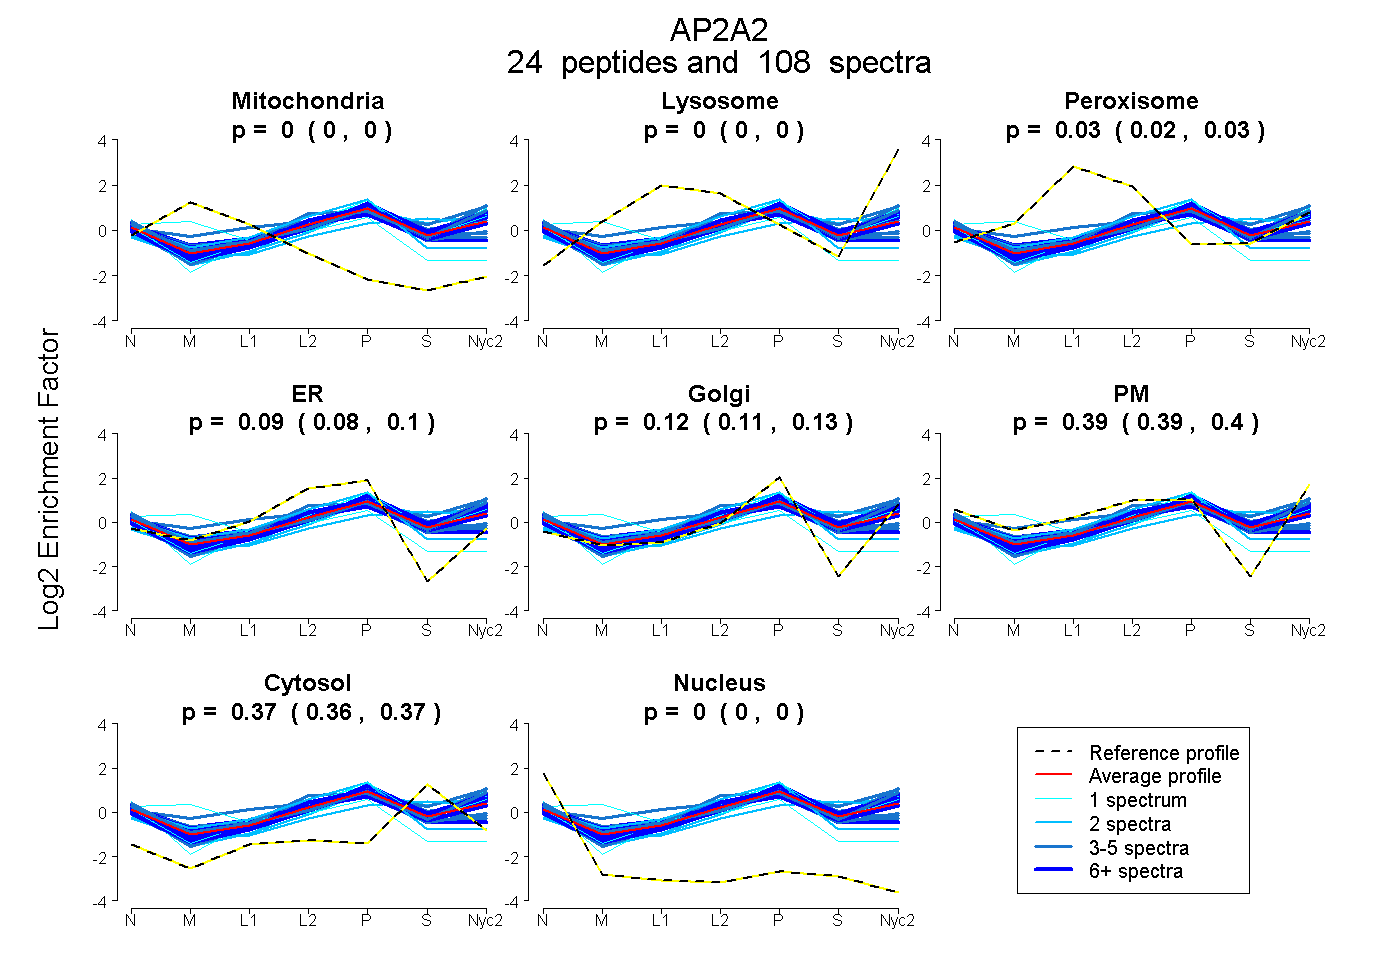
0.000 | 0.000
0.000 | 0.000
0.023 | 0.030
0.085 | 0.103
0.109 | 0.126
0.387 | 0.400
0.364 | 0.369
0.000 | 0.000
22peptides
spectra
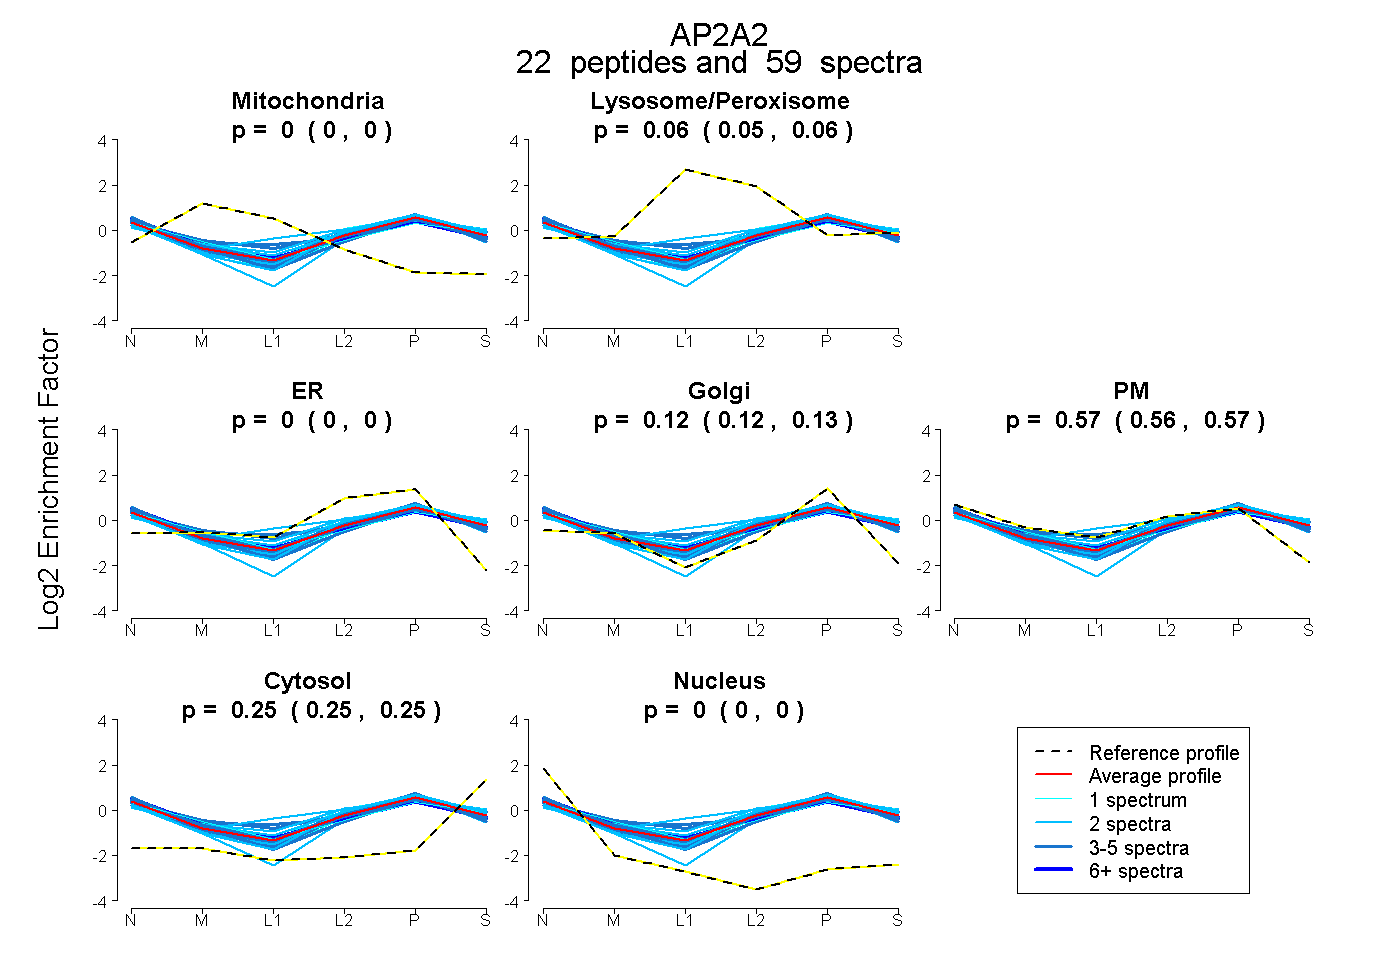
0.000 | 0.000
0.054 | 0.061
0.000 | 0.000
0.117 | 0.126
0.562 | 0.574
0.249 | 0.253
0.000 | 0.000
41peptides
spectra
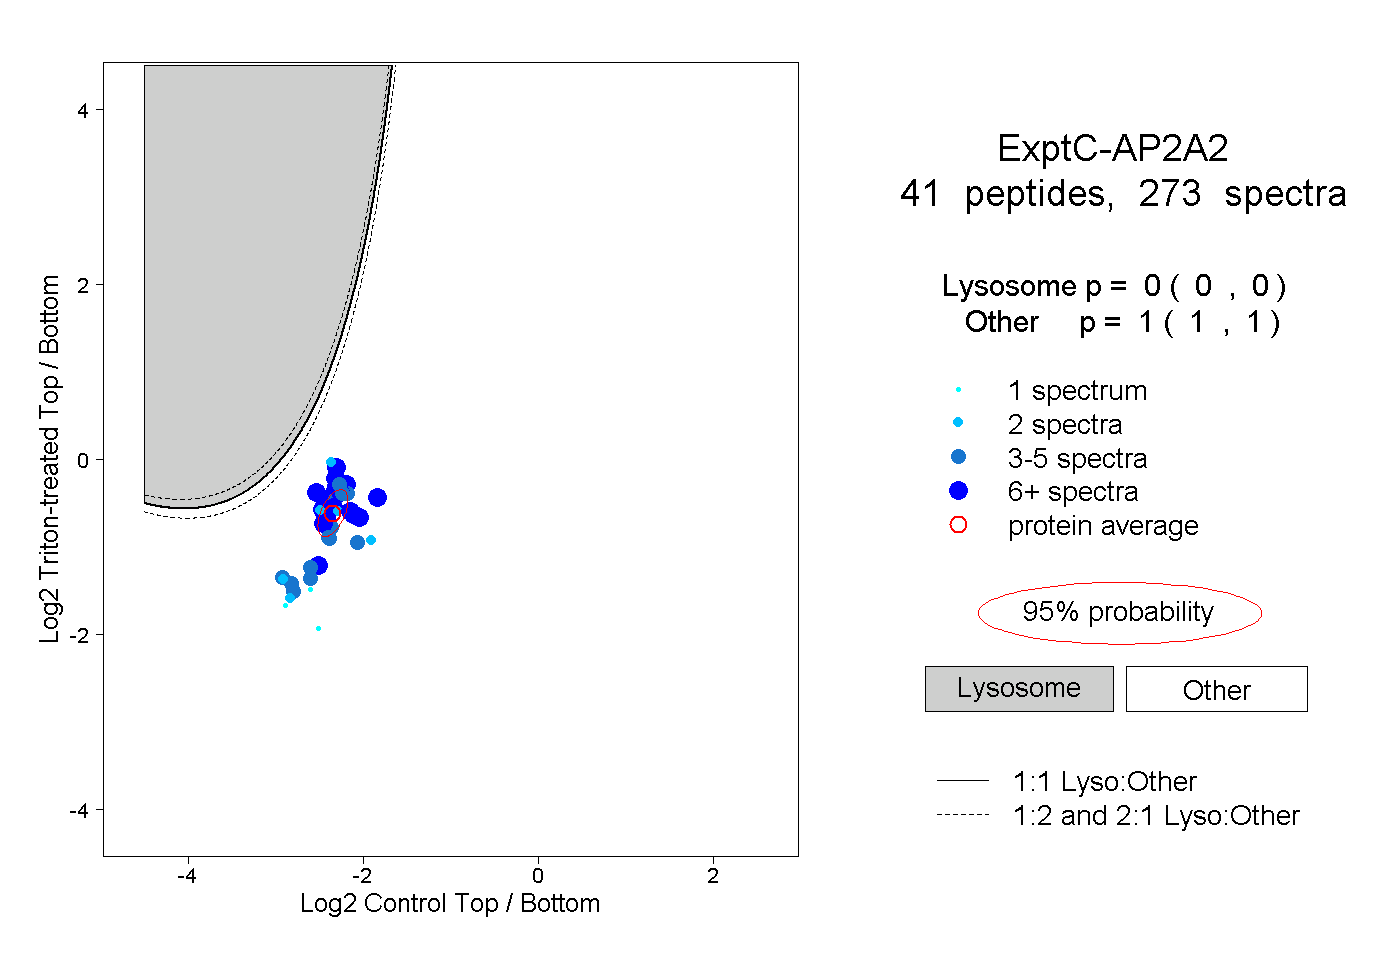
0.000 | 0.000
1.000 | 1.000
15peptides
spectra
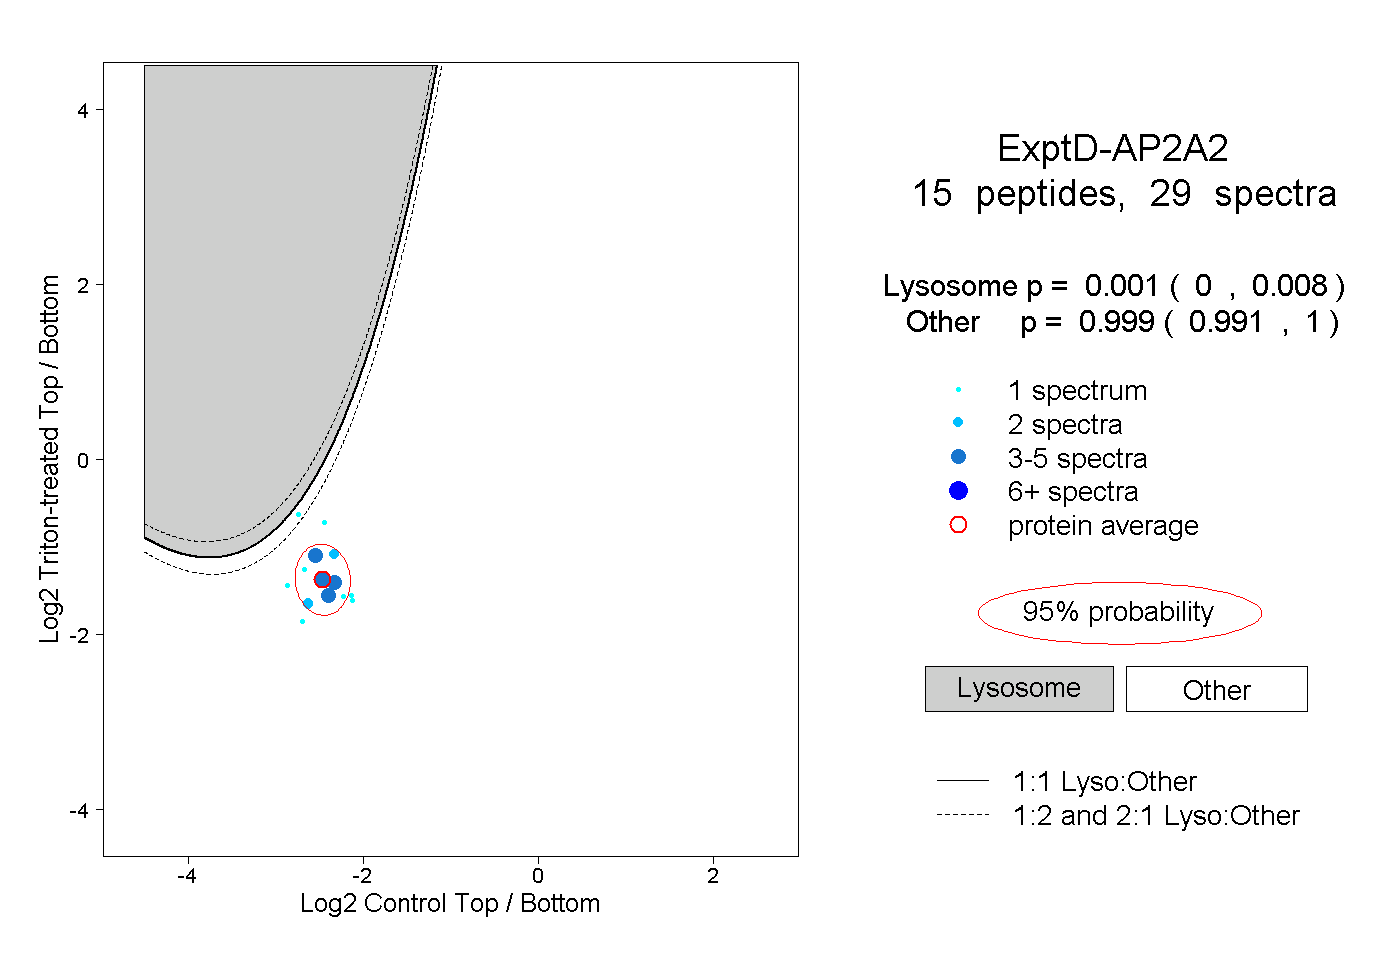
0.000 | 0.008
0.991 | 1.000