 3
3peptides
spectra
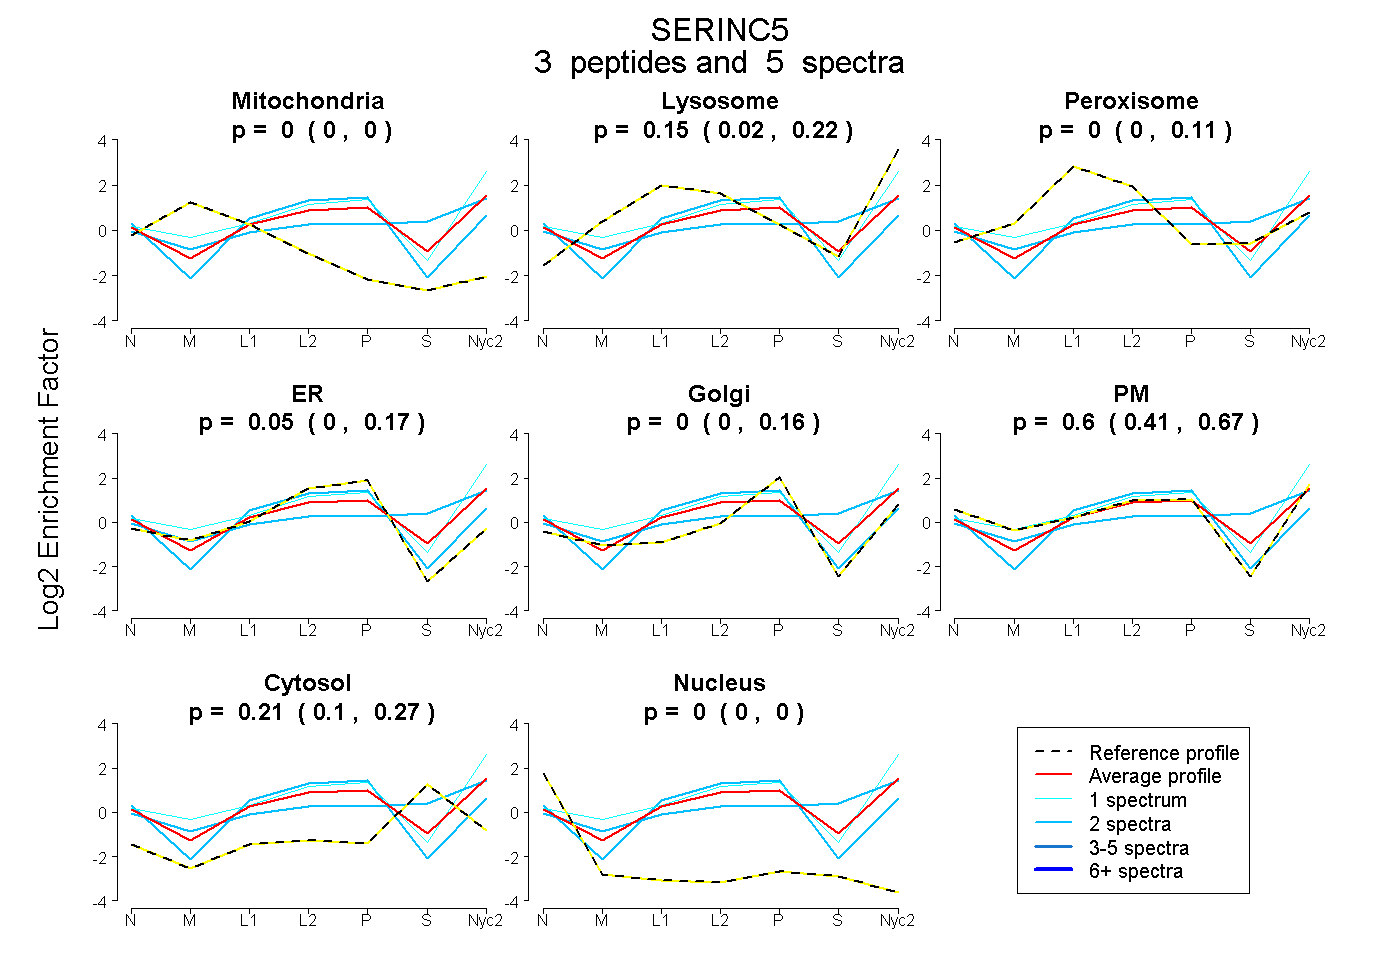
0.000 | 0.000
0.017 | 0.225
0.000 | 0.107
0.000 | 0.170
0.000 | 0.160
0.412 | 0.666
0.101 | 0.268
0.000 | 0.000
2peptides
spectra
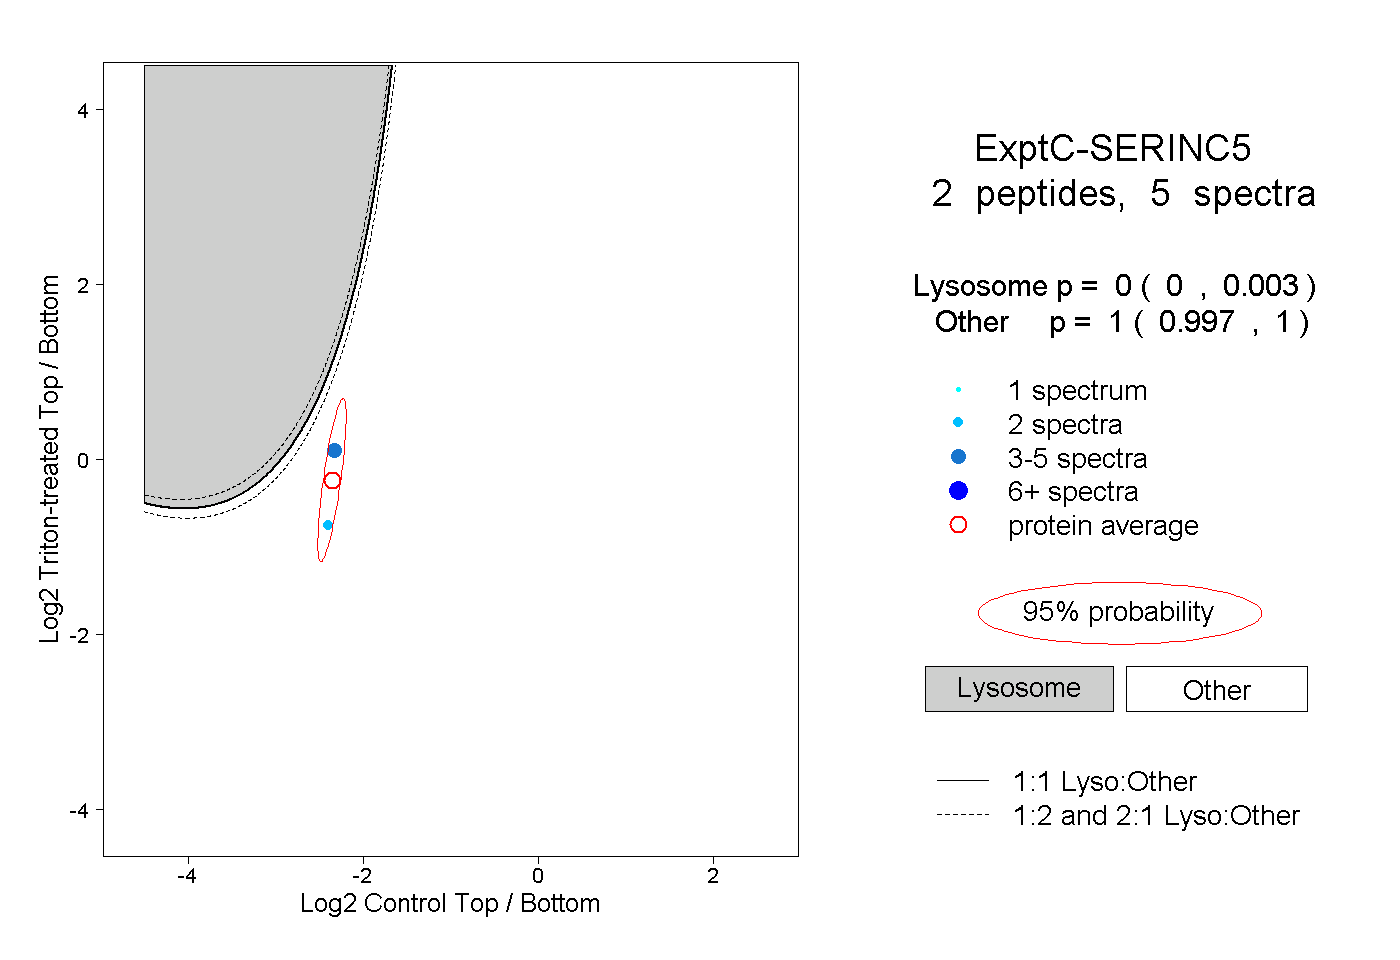
0.000 | 0.003
0.997 | 1.000
1peptide
spectrum
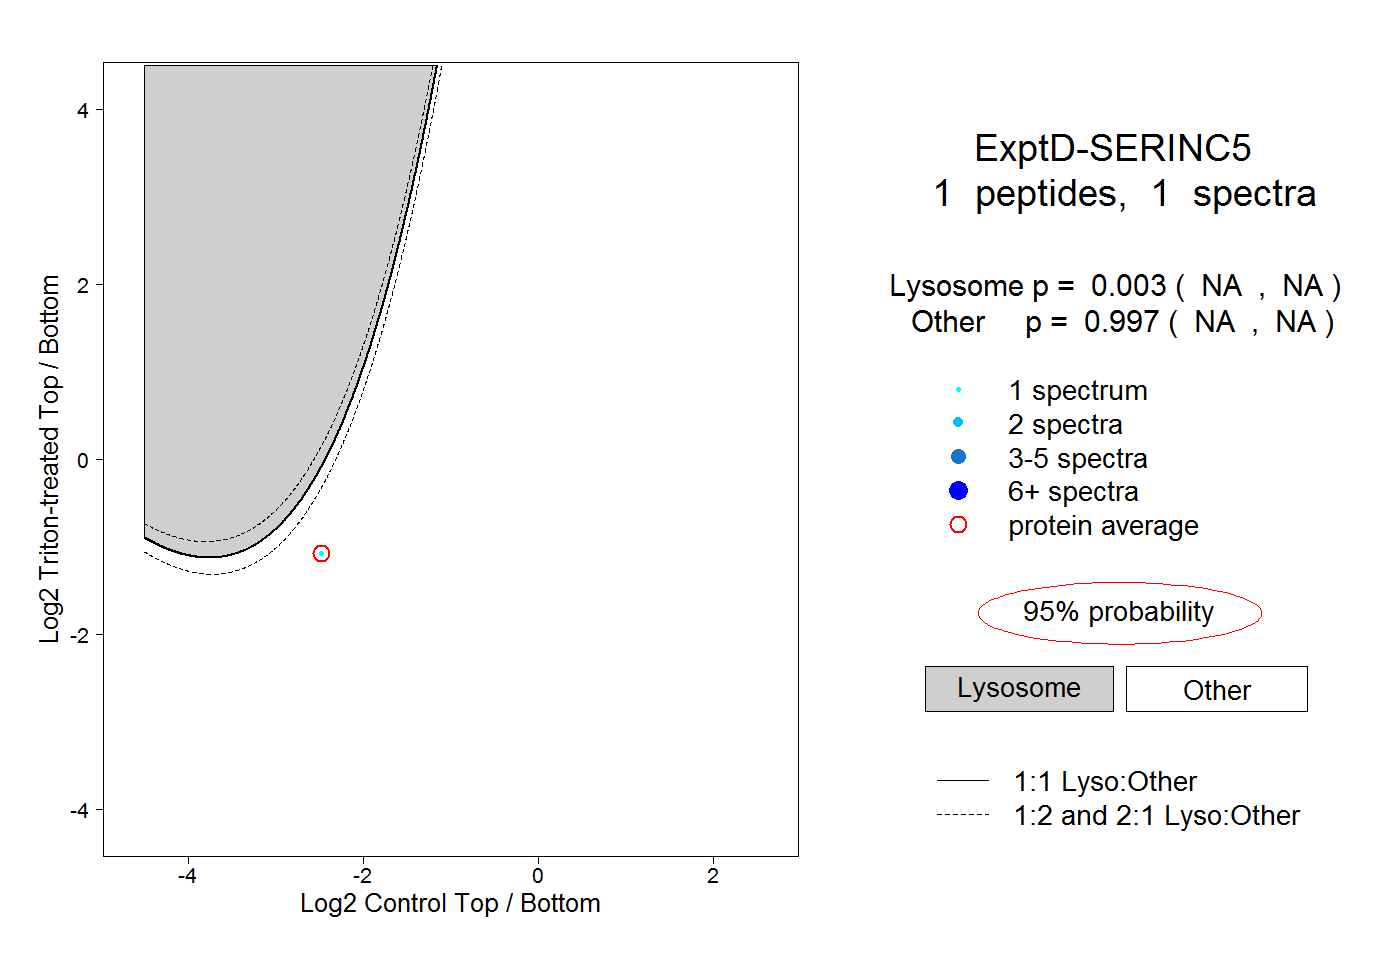
NA | NA
NA | NA