 3
3peptides
spectra
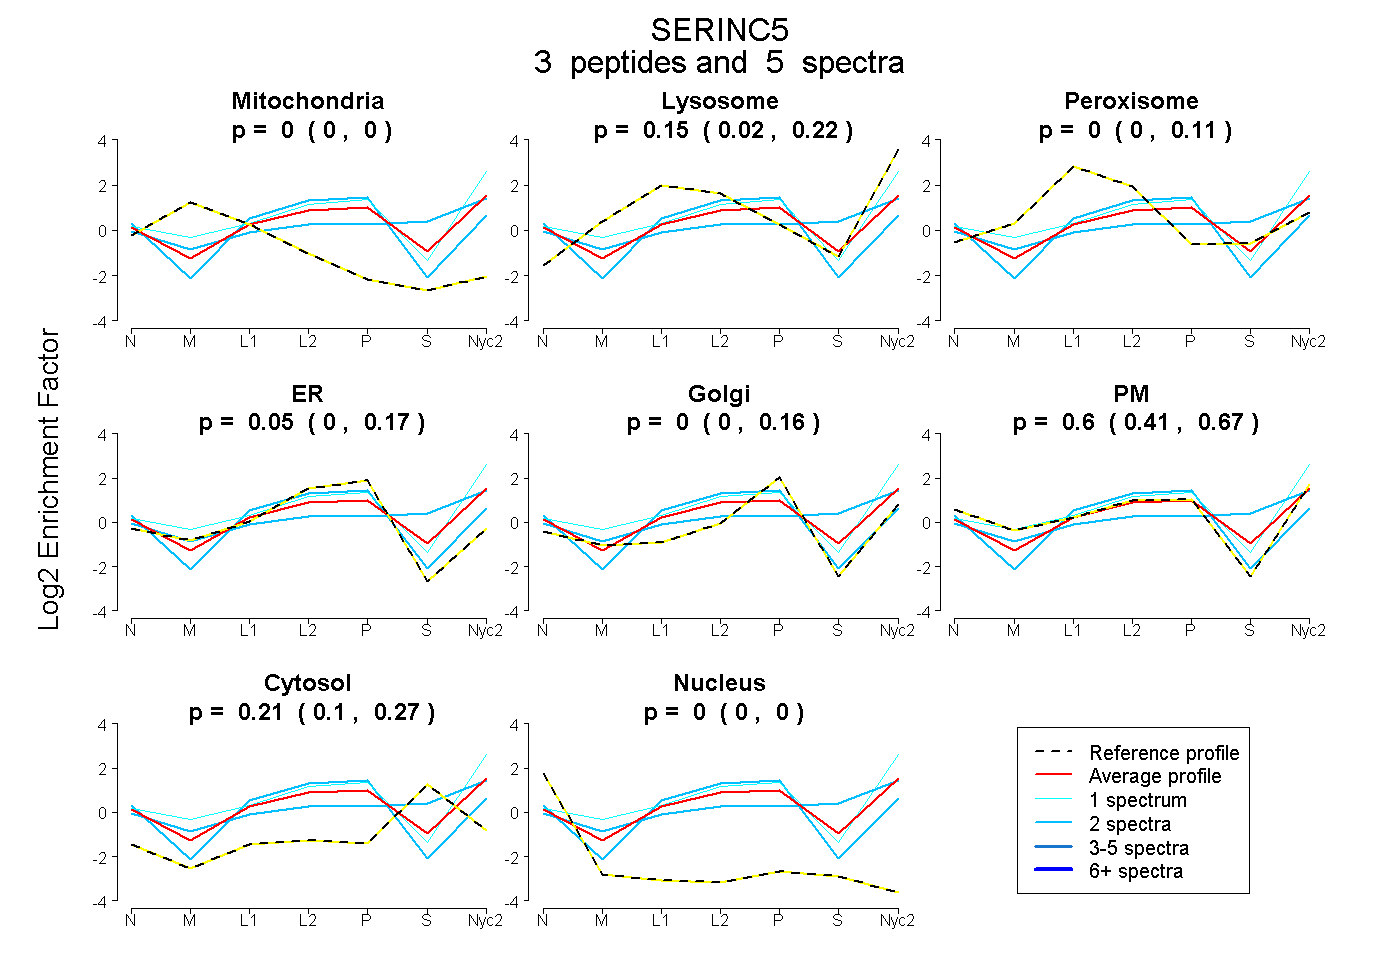
0.000 | 0.000
0.017 | 0.225
0.000 | 0.107
0.000 | 0.170
0.000 | 0.160
0.412 | 0.666
0.101 | 0.268
0.000 | 0.000
| Plot | Mito | Lyso | Perox | ER | Golgi | PM | Cytosol | Nucleus | |||||
| Expt A |
3 peptides |
5 spectra |
|
0.000 0.000 | 0.000 |
0.145 0.017 | 0.225 |
0.000 0.000 | 0.107 |
0.053 0.000 | 0.170 |
0.000 0.000 | 0.160 |
0.595 0.412 | 0.666 |
0.206 0.101 | 0.268 |
0.000 0.000 | 0.000 |
| 2 spectra, CCFCFGPDGEDTEEQQNVK | 0.000 | 0.000 | 0.009 | 0.520 | 0.000 | 0.375 | 0.096 | 0.000 | ||
| 1 spectrum, NWTAGTVR | 0.000 | 0.313 | 0.000 | 0.000 | 0.113 | 0.567 | 0.007 | 0.000 | ||
| 2 spectra, YGAPELEVAR | 0.000 | 0.254 | 0.007 | 0.000 | 0.000 | 0.329 | 0.410 | 0.000 |
| Plot | Lyso | Other | |||||||||||
| Expt C |
2 peptides |
5 spectra |
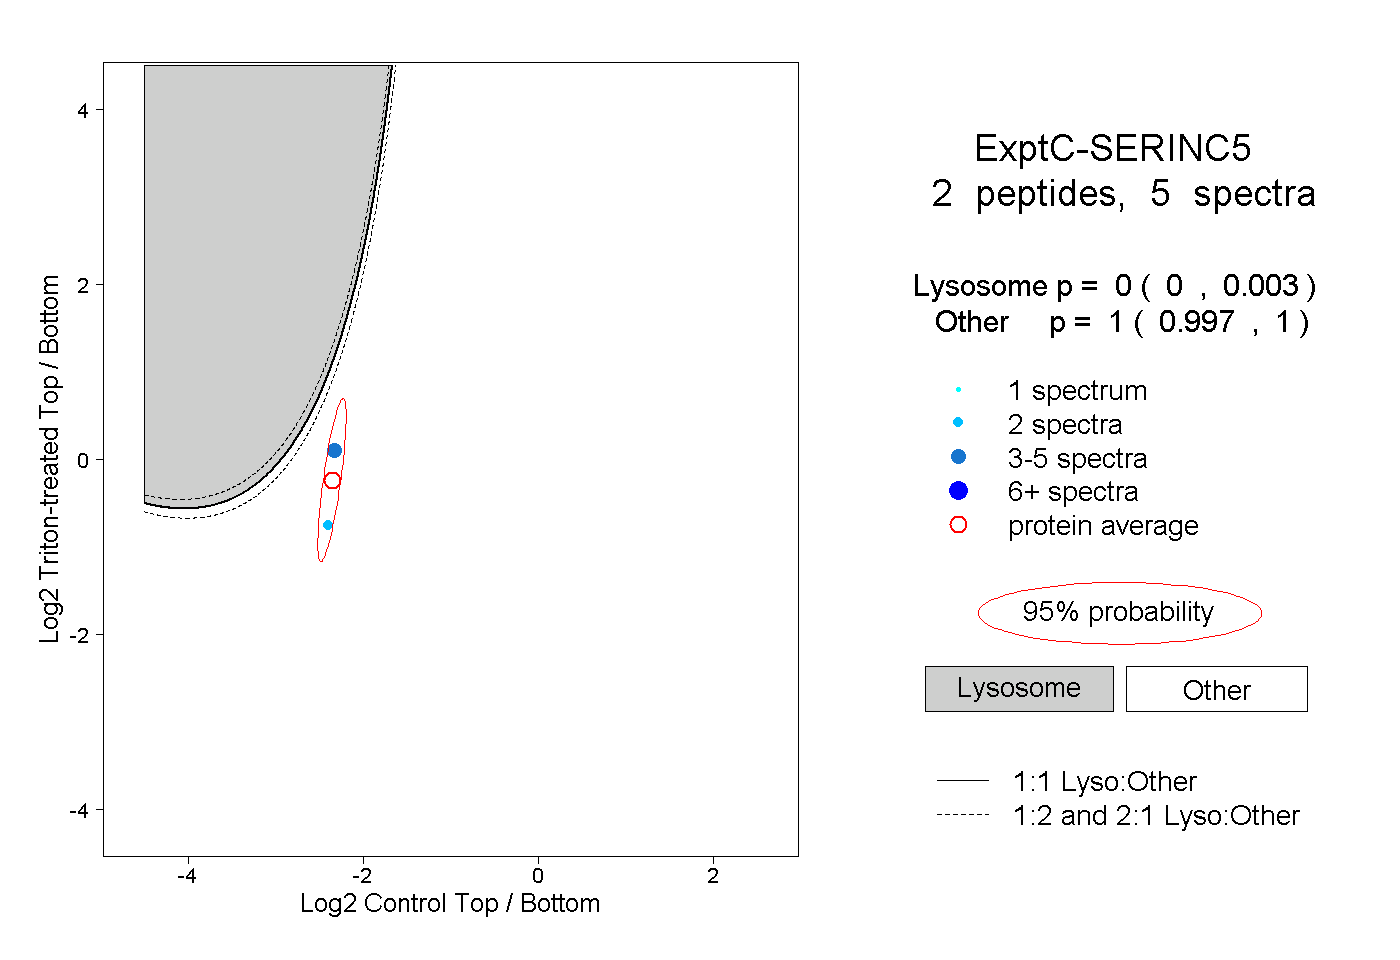 |
0.000 0.000 | 0.003 |
1.000 0.997 | 1.000 |
||||||||
| Plot | Lyso | Other | |||||||||||
| Expt D |
1 peptide |
1 spectrum |
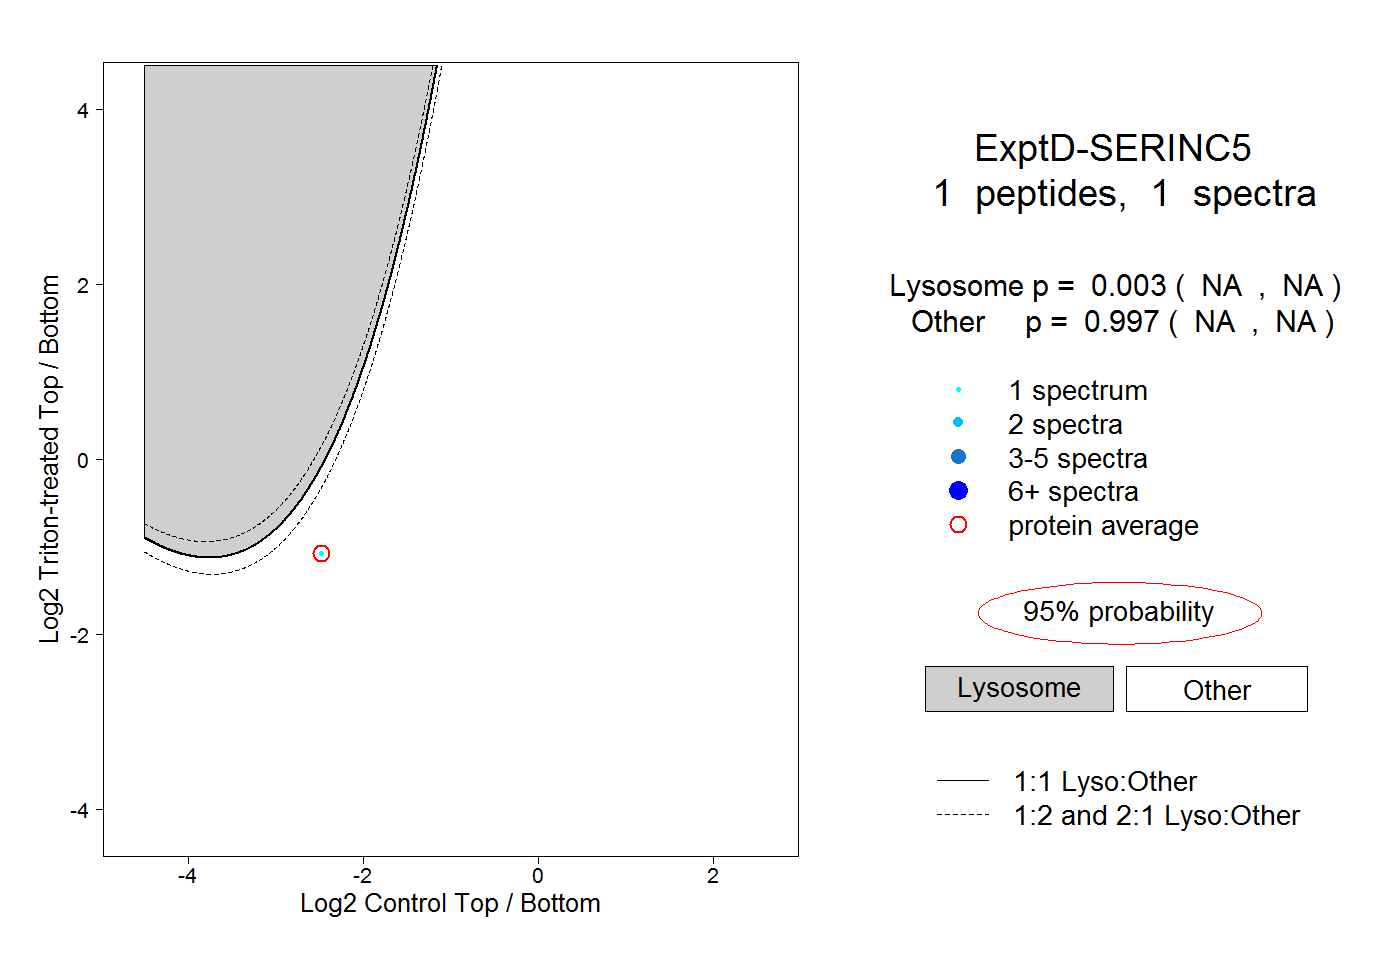 |
0.003 NA | NA |
0.997 NA | NA |