 7
7peptides
spectra
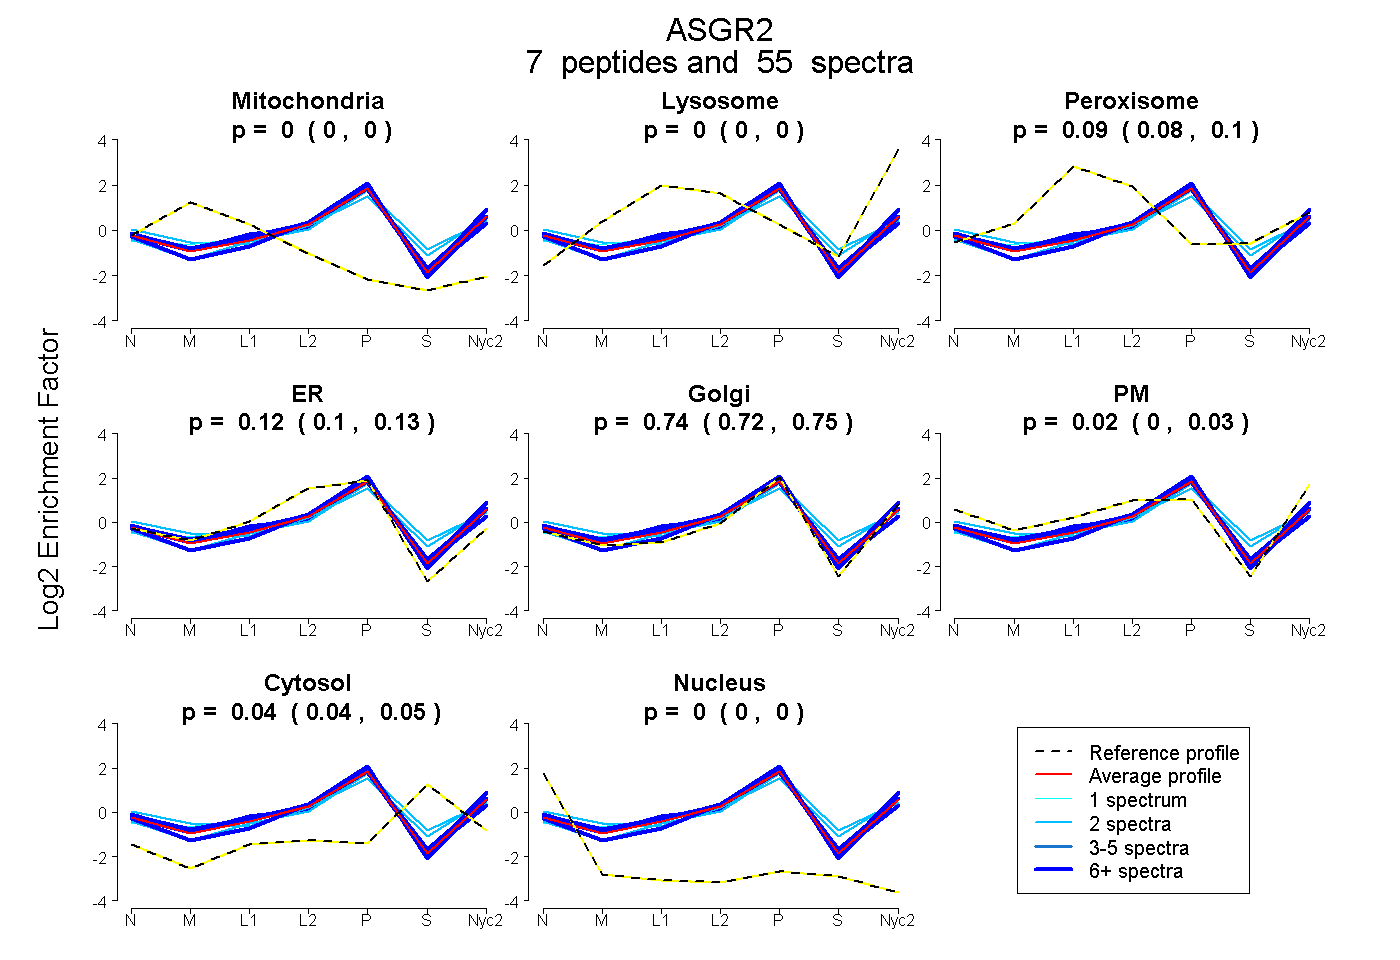
0.000 | 0.000
0.000 | 0.000
0.078 | 0.095
0.104 | 0.127
0.720 | 0.750
0.001 | 0.028
0.038 | 0.049
0.000 | 0.000
4peptides
spectra
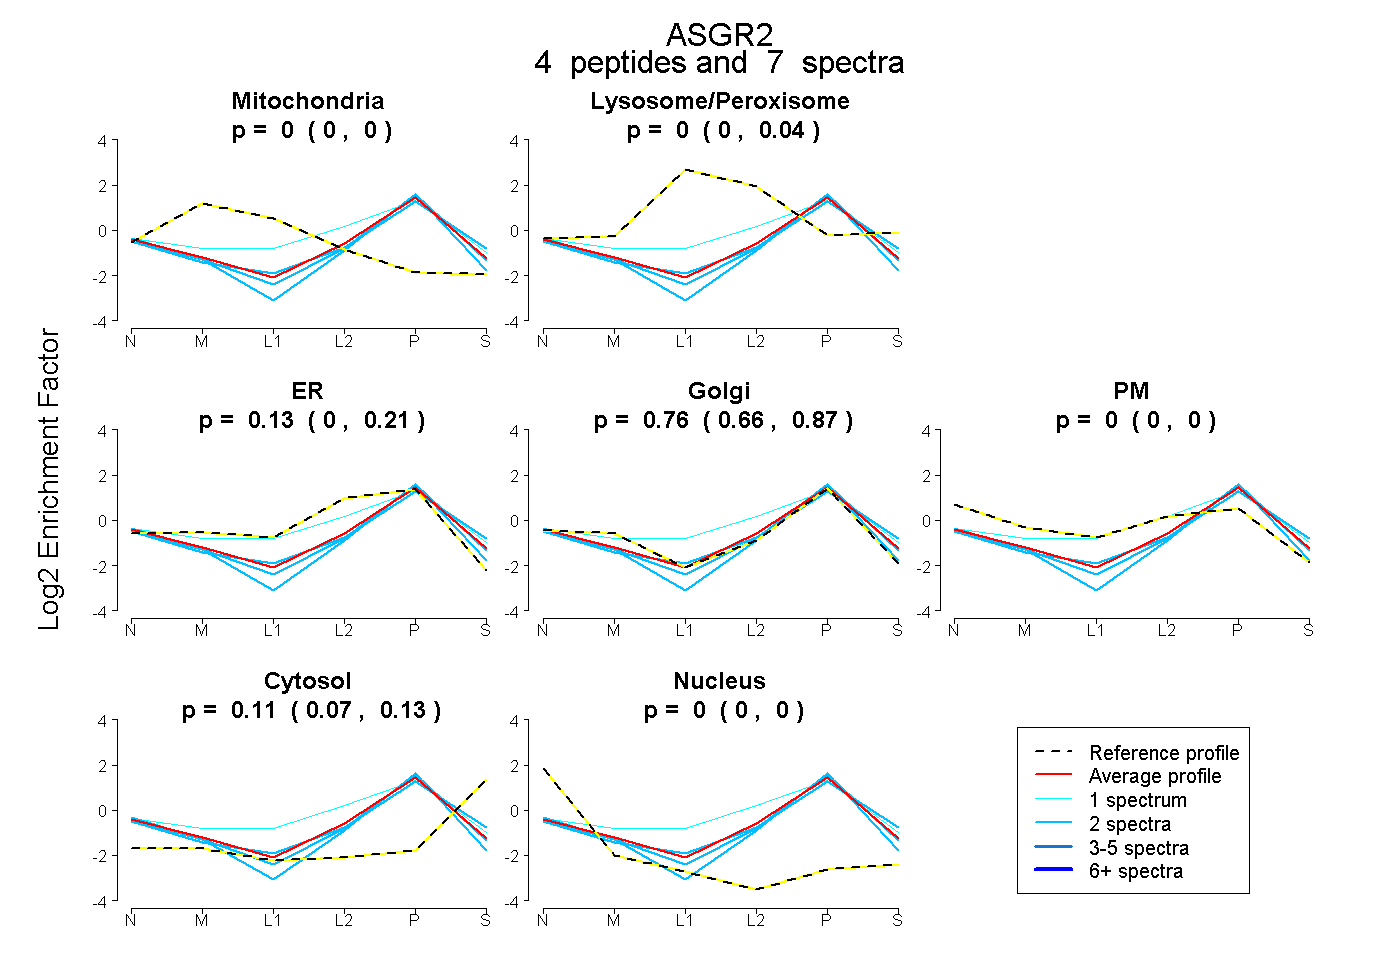
0.000 | 0.000
0.000 | 0.041
0.005 | 0.207
0.655 | 0.869
0.000 | 0.000
0.069 | 0.130
0.000 | 0.000
6peptides
spectra
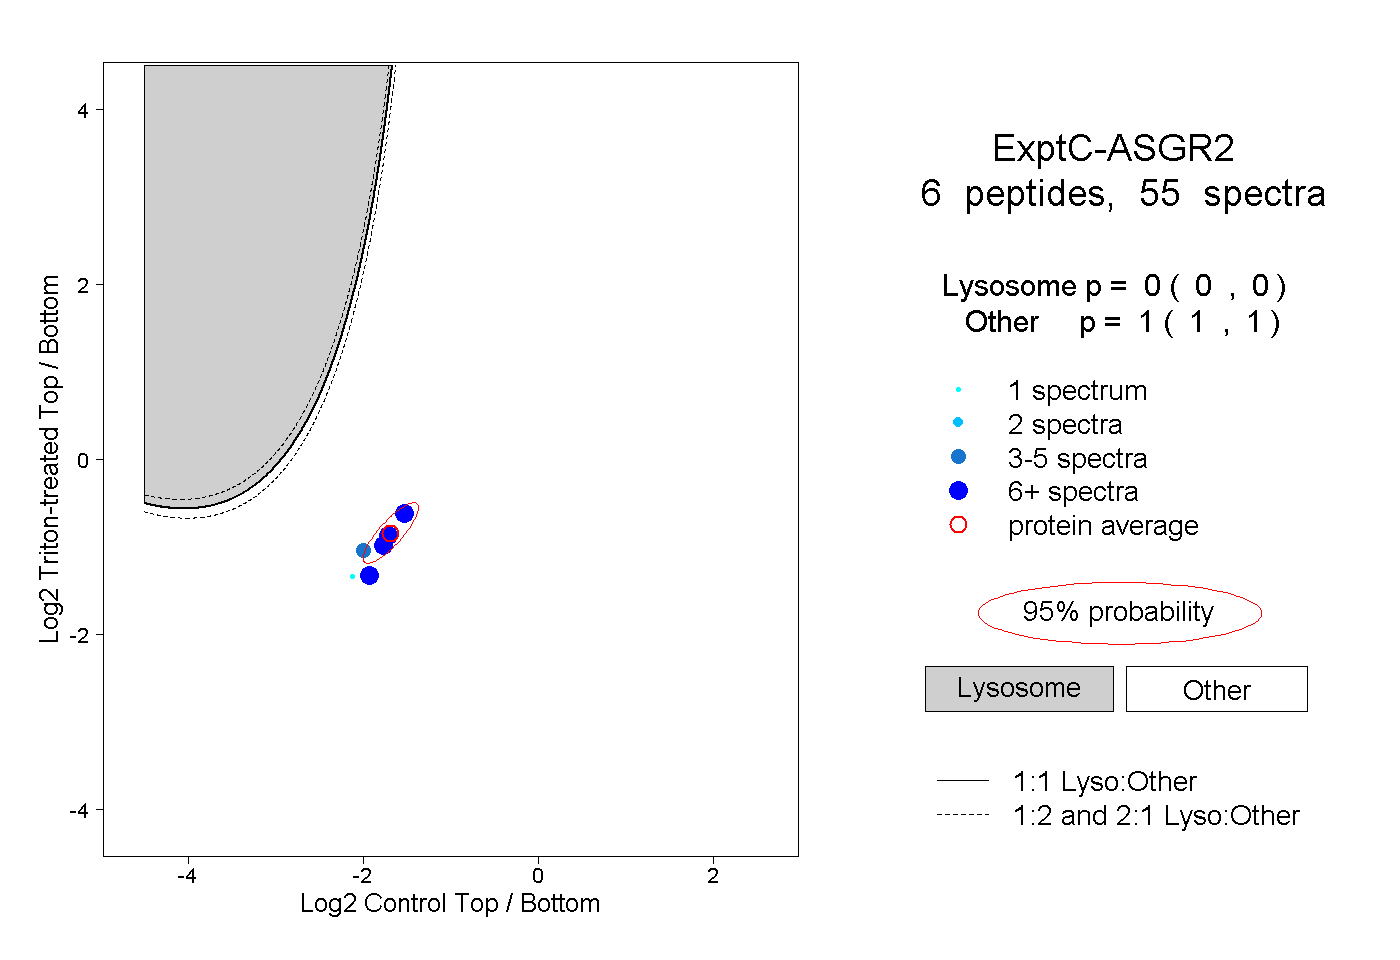
0.000 | 0.000
1.000 | 1.000
1peptide
spectra
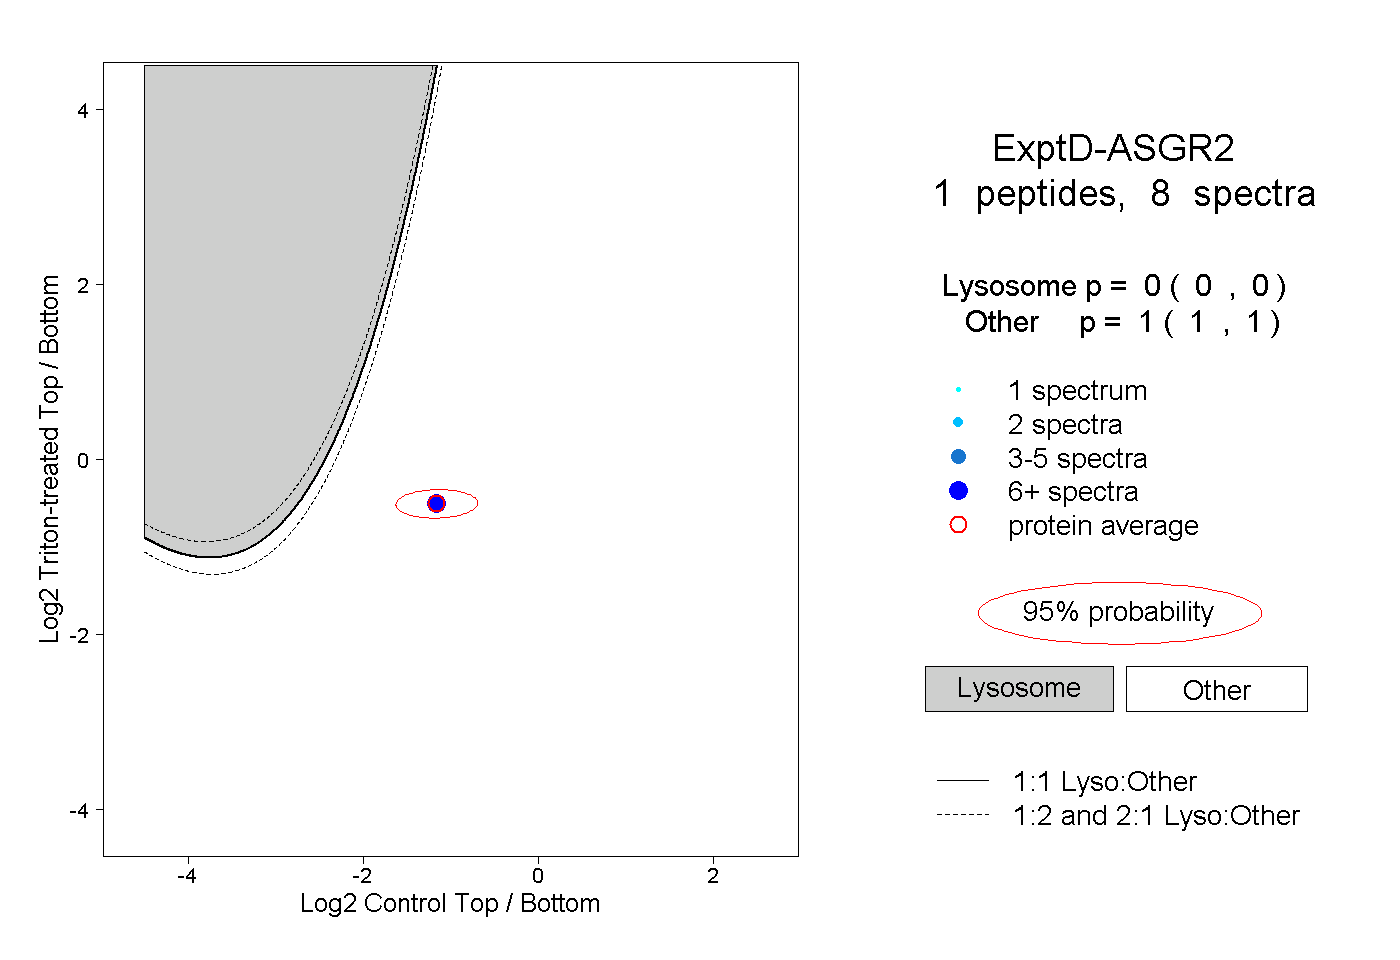
0.000 | 0.000
1.000 | 1.000