ASGR2
[ENSRNOP00000060474]
Main page
| | | Plot |
Mito |
Lyso |
|
Perox |
ER |
Golgi |
PM |
Cytosol |
Nucleus |
|
| Expt A |
 7
7
peptides |
55
spectra |
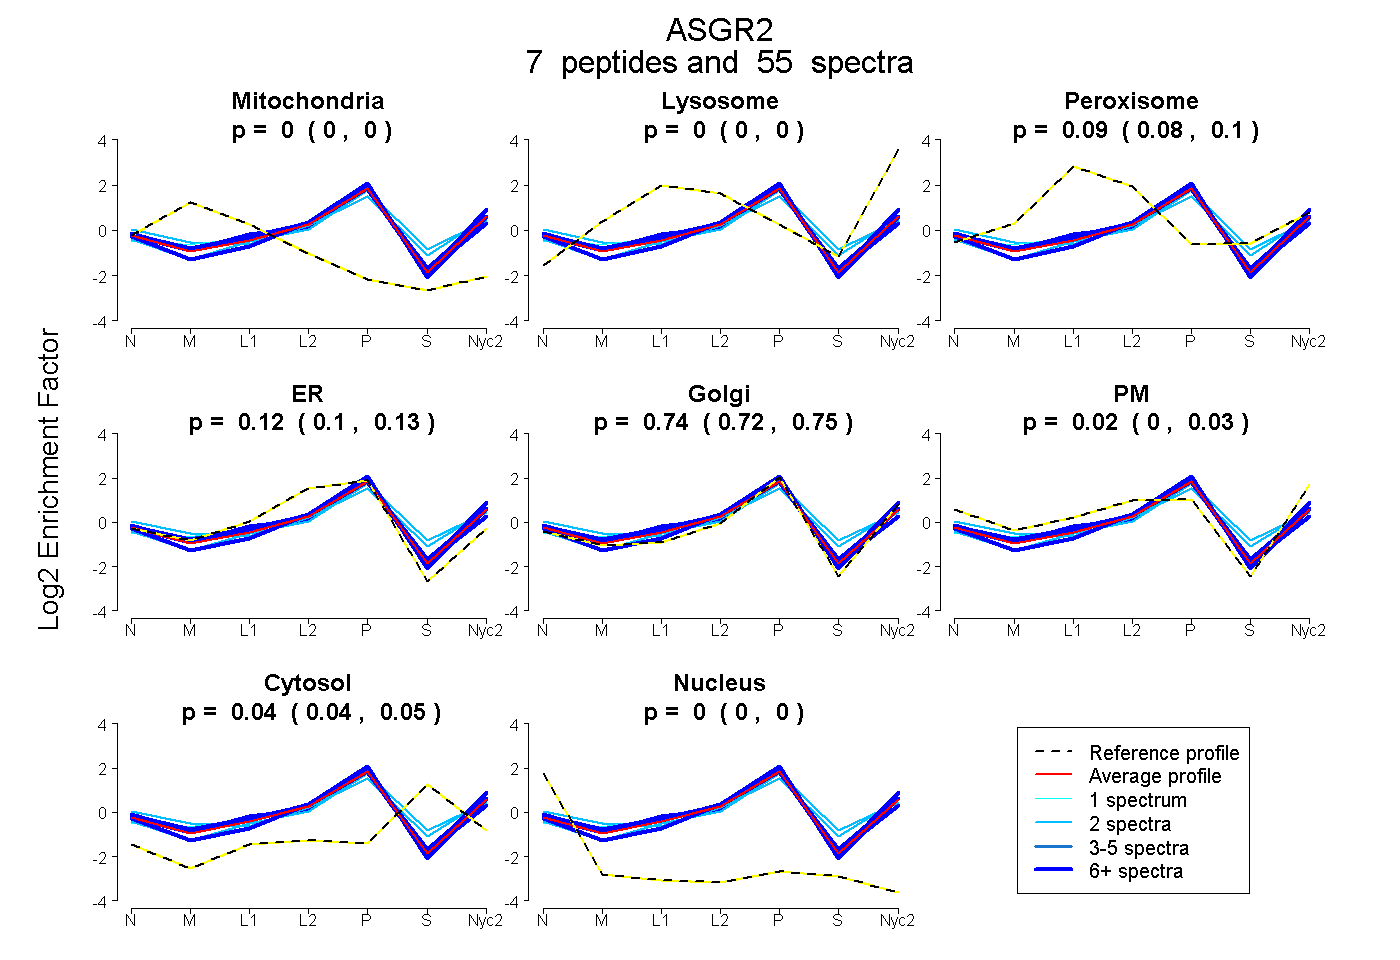 |
0.000
0.000 | 0.000 |
0.000
0.000 | 0.000 |
|
0.088
0.078 | 0.095 |
0.116
0.104 | 0.127 |
0.737
0.720 | 0.750 |
0.015
0.001 | 0.028 |
0.044
0.038 | 0.049 |
0.000
0.000 | 0.000 |
|
| | | Plot |
Mito |
|
Lyso or Perox |
|
ER |
Golgi |
PM |
Cytosol |
Nucleus |
|
| Expt B |
4
peptides |
7
spectra |
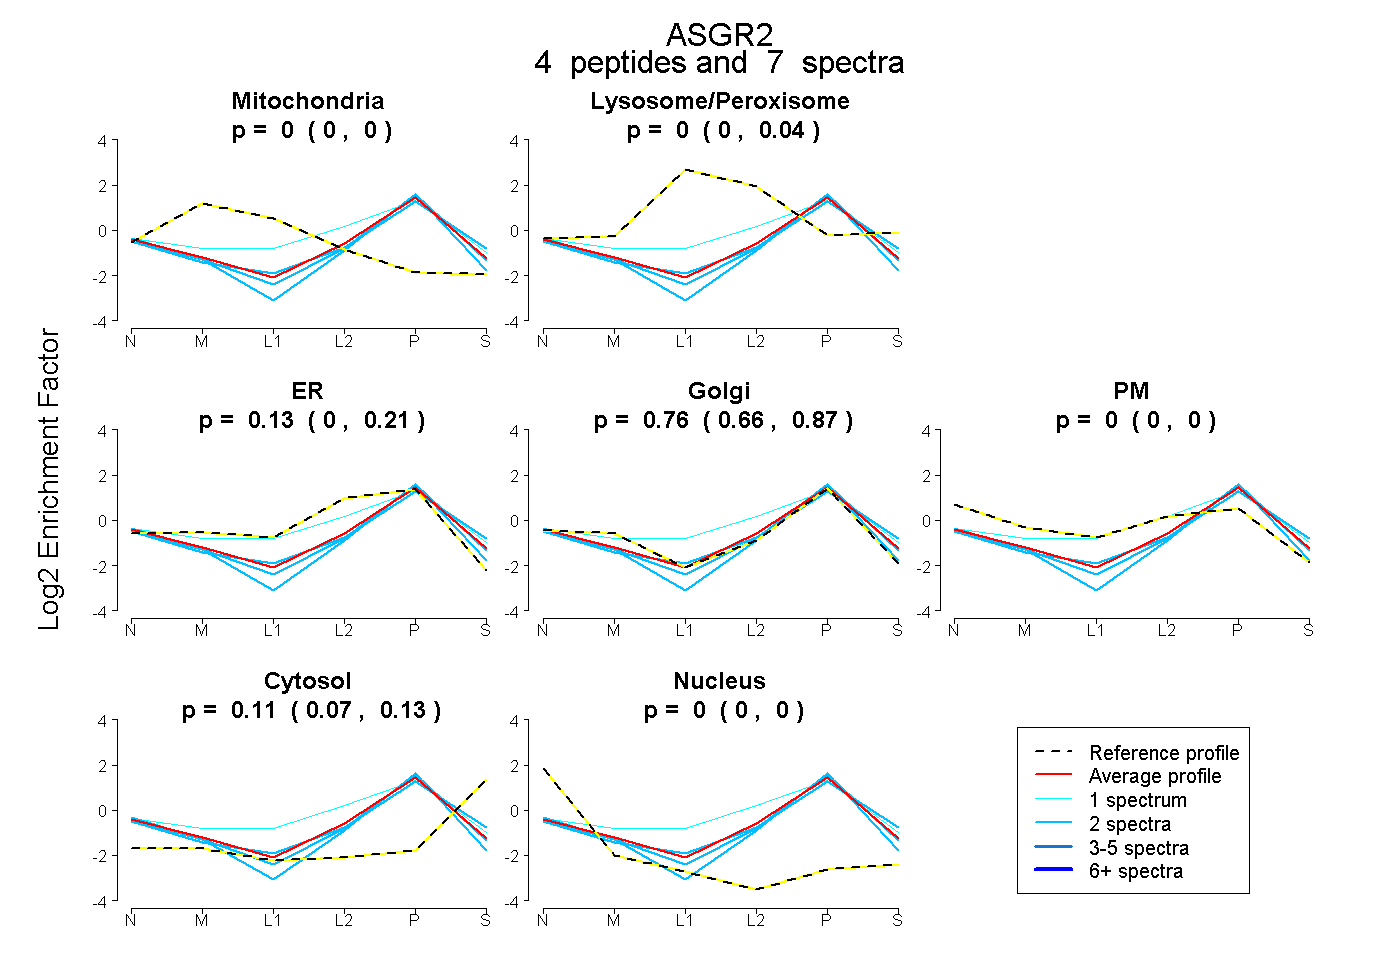 |
0.000
0.000 | 0.000 |
|
0.000
0.000 | 0.041 |
|
0.135
0.005 | 0.207 |
0.759
0.655 | 0.869 |
0.000
0.000 | 0.000 |
0.106
0.069 | 0.130 |
0.000
0.000 | 0.000 |
|
| 1 spectrum, ADHSTLLFHLK |
0.000 |
|
0.261 |
|
0.109 |
0.608 |
0.000 |
0.022 |
0.000 |
|
| 2 spectra, EEQEFVVK |
0.000 |
|
0.028 |
|
0.079 |
0.696 |
0.000 |
0.198 |
0.000 |
|
| 2 spectra, WVDGTEYR |
0.000 |
|
0.000 |
|
0.000 |
0.914 |
0.000 |
0.086 |
0.000 |
|
| 2 spectra, WGGQPPSRPFPQR |
0.000 |
|
0.000 |
|
0.000 |
0.964 |
0.000 |
0.008 |
0.028 |
|
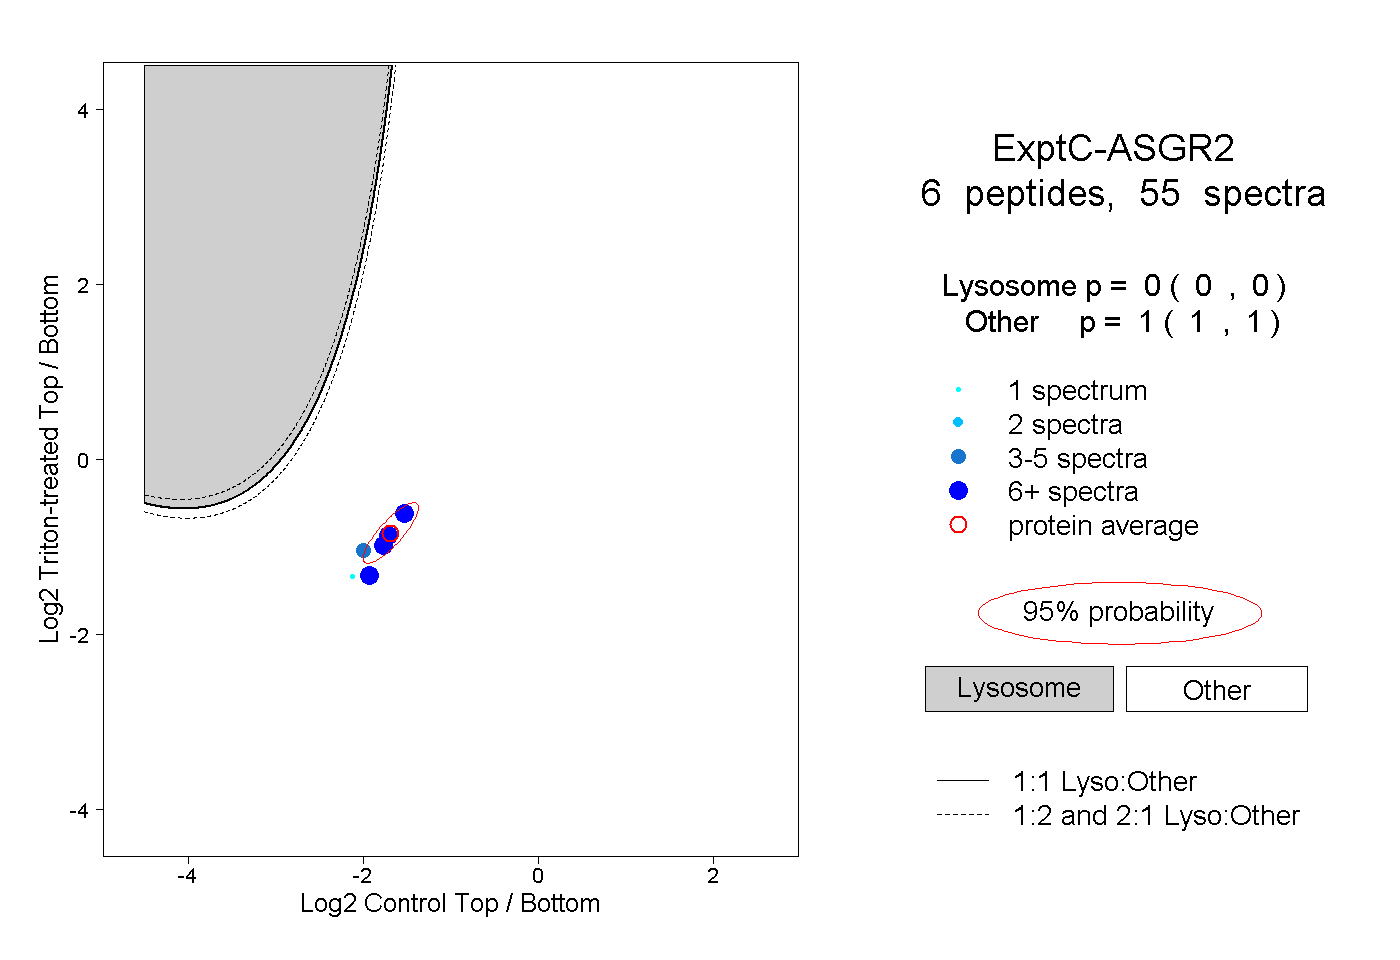
| | | Plot |
|
Lyso |
|
|
|
|
|
|
|
Other |
| Expt C |
6
peptides |
55
spectra |
 |
|
0.000
0.000 | 0.000 |
|
|
|
|
|
|
|
1.000
1.000 | 1.000 |
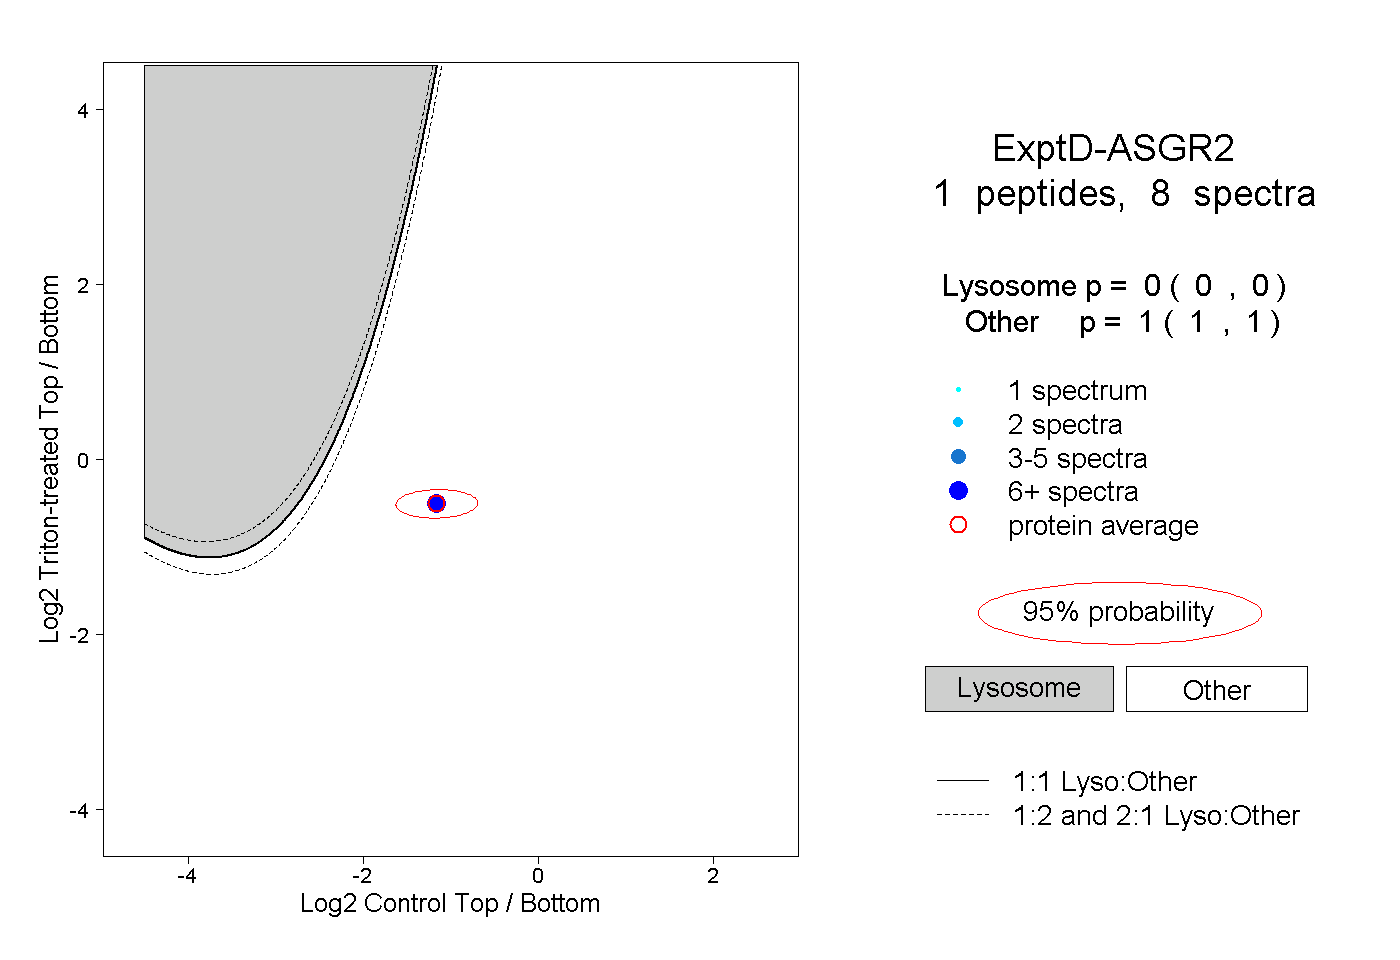
| | | Plot |
|
Lyso |
|
|
|
|
|
|
|
Other |
| Expt D |
1
peptide |
8
spectra |
 |
|
0.000
0.000 | 0.000 |
|
|
|
|
|
|
|
1.000
1.000 | 1.000 |