 10
10peptides
spectra

0.000 | 0.018
0.000 | 0.000
0.090 | 0.144
0.407 | 0.535
0.237 | 0.360
0.000 | 0.000
0.038 | 0.099
0.010 | 0.039
4peptides
spectra
0.000 | 0.000
1.000 | 1.000
| Plot | Mito | Lyso | Perox | ER | Golgi | PM | Cytosol | Nucleus | |||||
| Expt A |
10 peptides |
20 spectra |
|
0.000 0.000 | 0.018 |
0.000 0.000 | 0.000 |
0.124 0.090 | 0.144 |
0.476 0.407 | 0.535 |
0.302 0.237 | 0.360 |
0.000 0.000 | 0.000 |
0.070 0.038 | 0.099 |
0.028 0.010 | 0.039 |
||
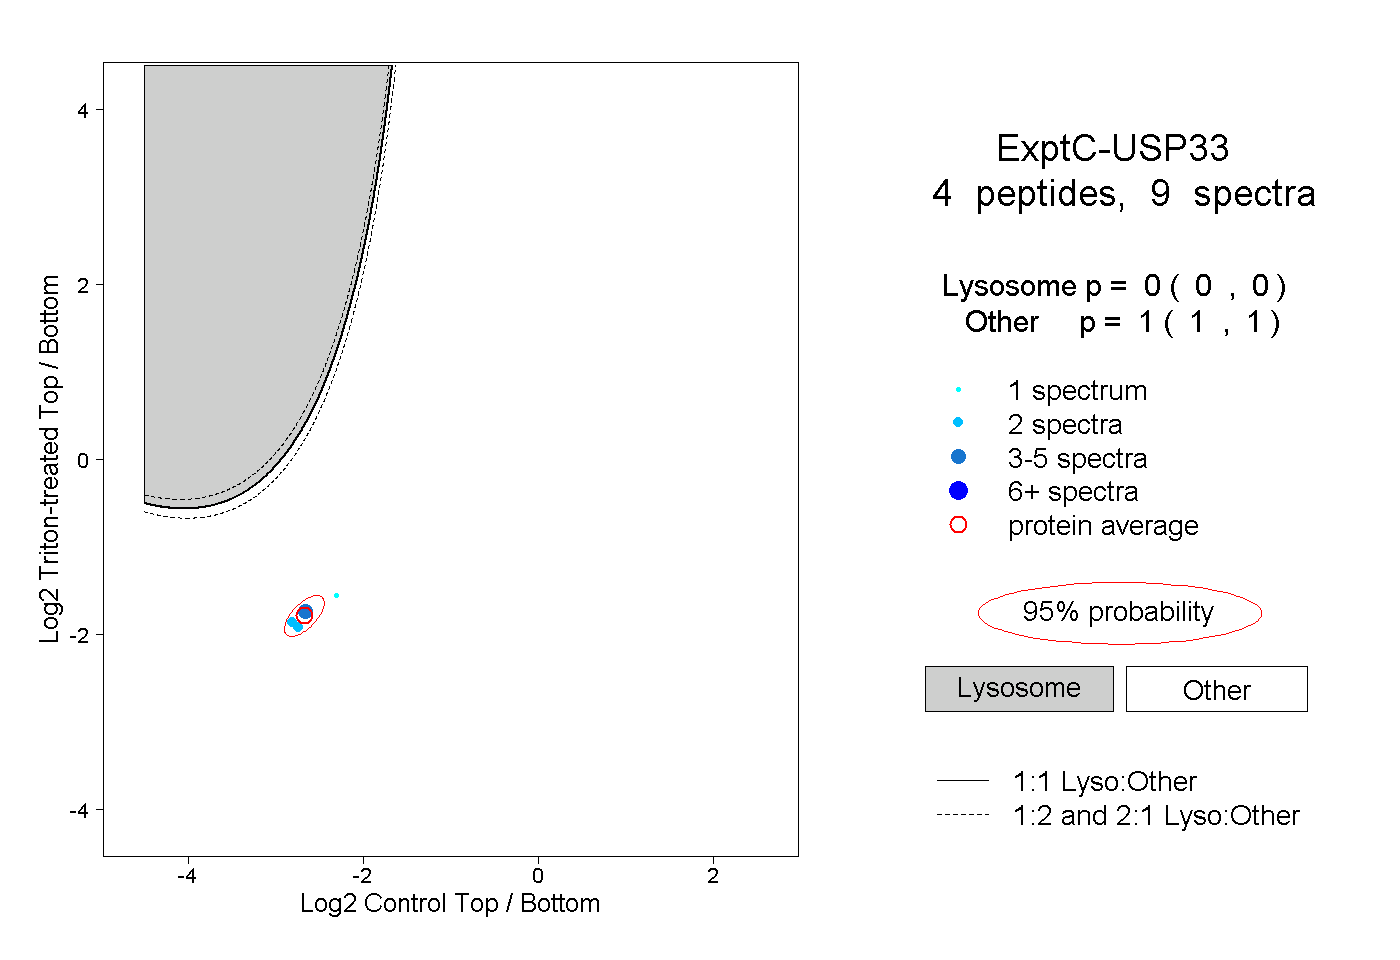
| Plot | Lyso | Other | |||||||||||
| Expt C |
4 peptides |
9 spectra |
|
0.000 0.000 | 0.000 |
1.000 1.000 | 1.000 |