 10
10peptides
spectra

0.000 | 0.018
0.000 | 0.000
0.090 | 0.144
0.407 | 0.535
0.237 | 0.360
0.000 | 0.000
0.038 | 0.099
0.010 | 0.039
| Plot | Mito | Lyso | Perox | ER | Golgi | PM | Cytosol | Nucleus | |||||
| Expt A |
10 peptides |
20 spectra |
|
0.000 0.000 | 0.018 |
0.000 0.000 | 0.000 |
0.124 0.090 | 0.144 |
0.476 0.407 | 0.535 |
0.302 0.237 | 0.360 |
0.000 0.000 | 0.000 |
0.070 0.038 | 0.099 |
0.028 0.010 | 0.039 |
| 3 spectra, LMTELWHK | 0.079 | 0.000 | 0.000 | 0.858 | 0.000 | 0.000 | 0.000 | 0.063 | ||
| 1 spectrum, AQSSSPK | 0.000 | 0.000 | 0.036 | 0.553 | 0.373 | 0.000 | 0.038 | 0.000 | ||
| 2 spectra, SHGACQDCK | 0.000 | 0.000 | 0.000 | 0.578 | 0.099 | 0.000 | 0.323 | 0.000 | ||
| 1 spectrum, KPALCK | 0.159 | 0.000 | 0.155 | 0.223 | 0.297 | 0.000 | 0.166 | 0.000 | ||
| 2 spectra, FPEILCIHLK | 0.094 | 0.000 | 0.000 | 0.856 | 0.000 | 0.000 | 0.000 | 0.050 | ||
| 2 spectra, GPNLWACLENR | 0.000 | 0.000 | 0.000 | 0.798 | 0.077 | 0.000 | 0.000 | 0.125 | ||
| 2 spectra, EWESFVK | 0.000 | 0.000 | 0.000 | 0.575 | 0.190 | 0.216 | 0.000 | 0.018 | ||
| 1 spectrum, LSASPPK | 0.000 | 0.000 | 0.144 | 0.000 | 0.627 | 0.000 | 0.181 | 0.049 | ||
| 1 spectrum, HYLTVNLTTLR | 0.000 | 0.537 | 0.000 | 0.000 | 0.224 | 0.072 | 0.166 | 0.000 | ||
| 5 spectra, LGTPPSLPHVR | 0.000 | 0.000 | 0.422 | 0.174 | 0.337 | 0.000 | 0.066 | 0.000 |
| Plot | Lyso | Other | |||||||||||
| Expt C |
4 peptides |
9 spectra |
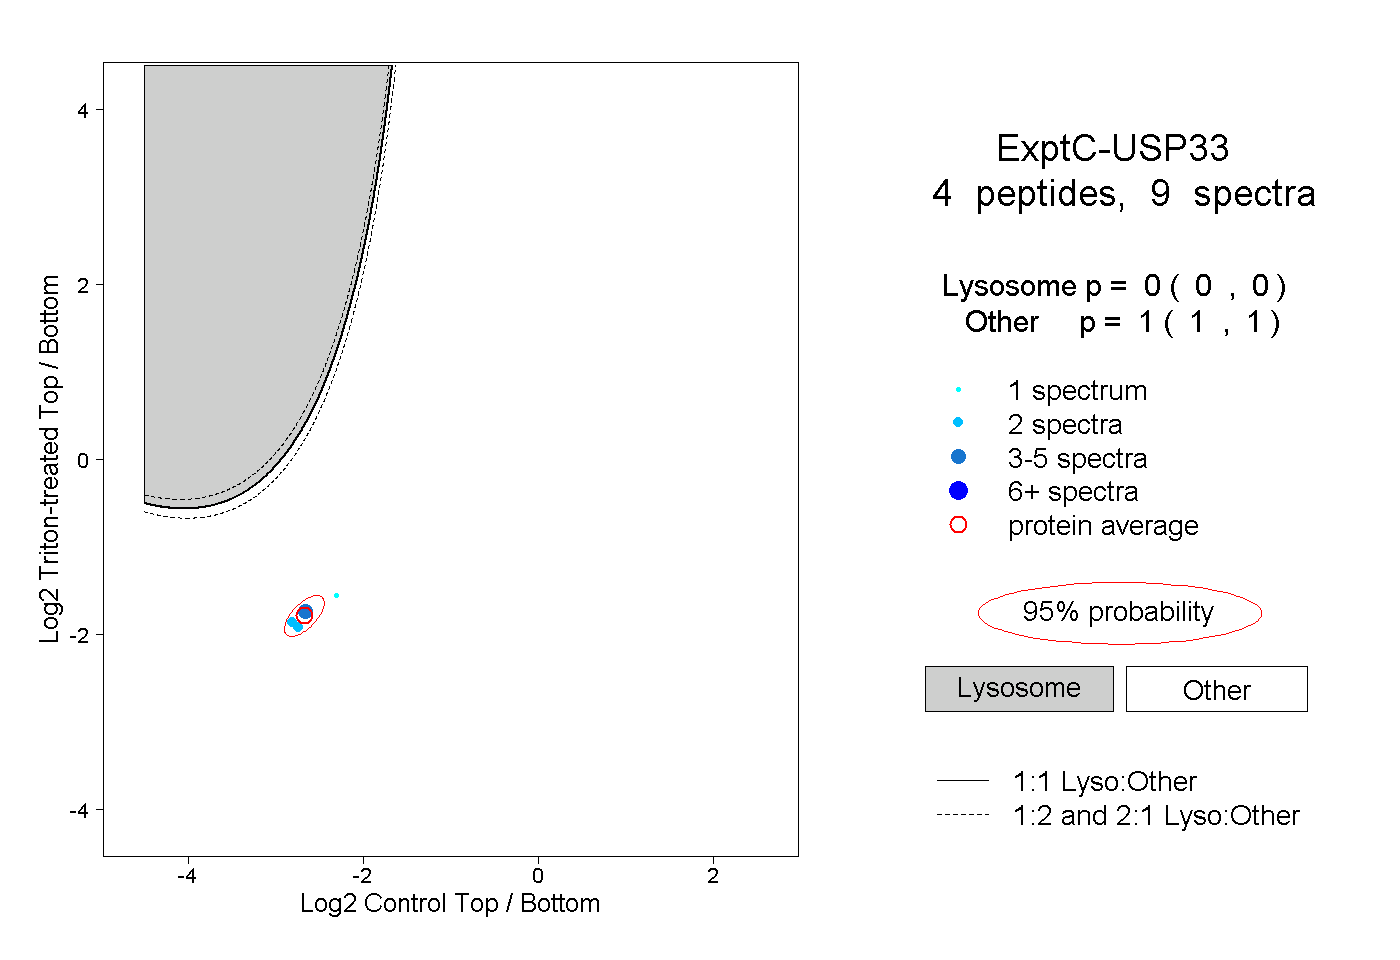 |
0.000 0.000 | 0.000 |
1.000 1.000 | 1.000 |