 14
14peptides
spectra
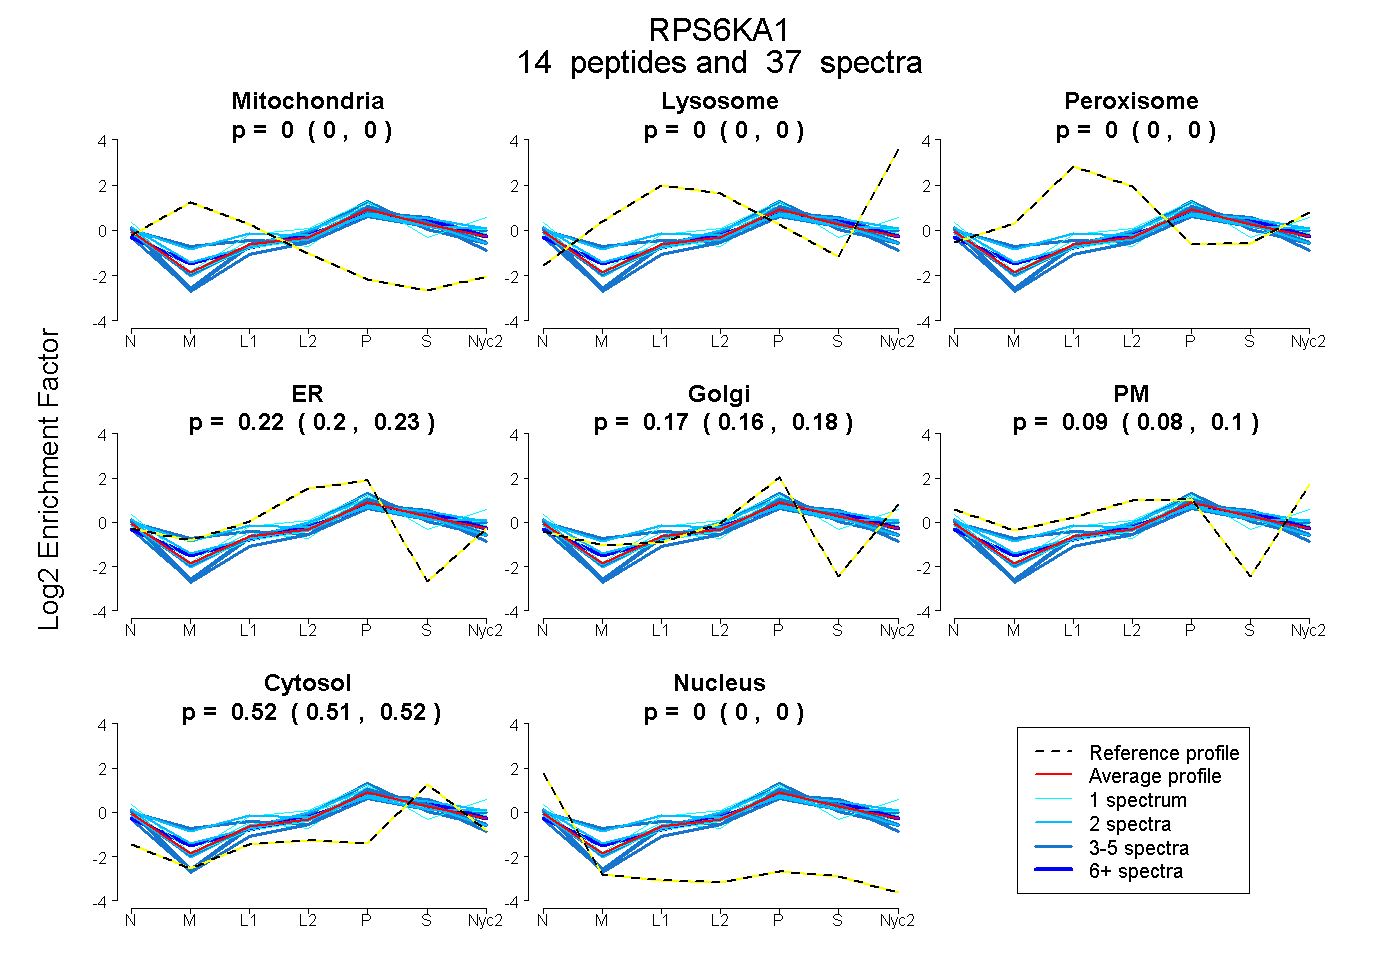
0.000 | 0.000
0.000 | 0.000
0.000 | 0.002
0.204 | 0.228
0.159 | 0.182
0.080 | 0.103
0.515 | 0.522
0.000 | 0.000
5peptides
spectra
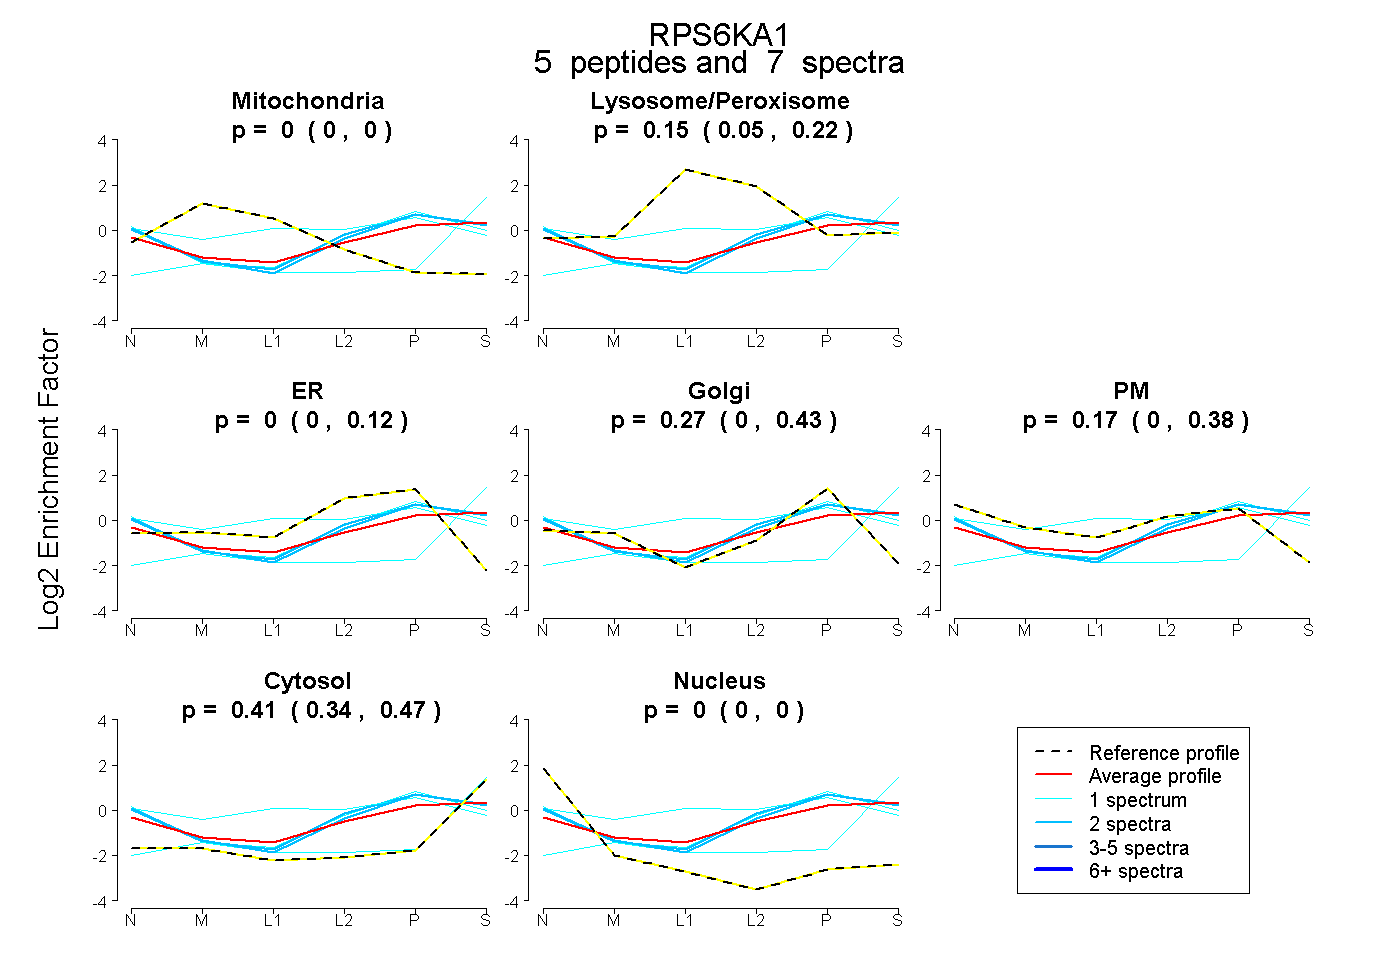
0.000 | 0.000
0.054 | 0.216
0.000 | 0.120
0.000 | 0.426
0.000 | 0.383
0.344 | 0.475
0.000 | 0.000
14peptides
spectra
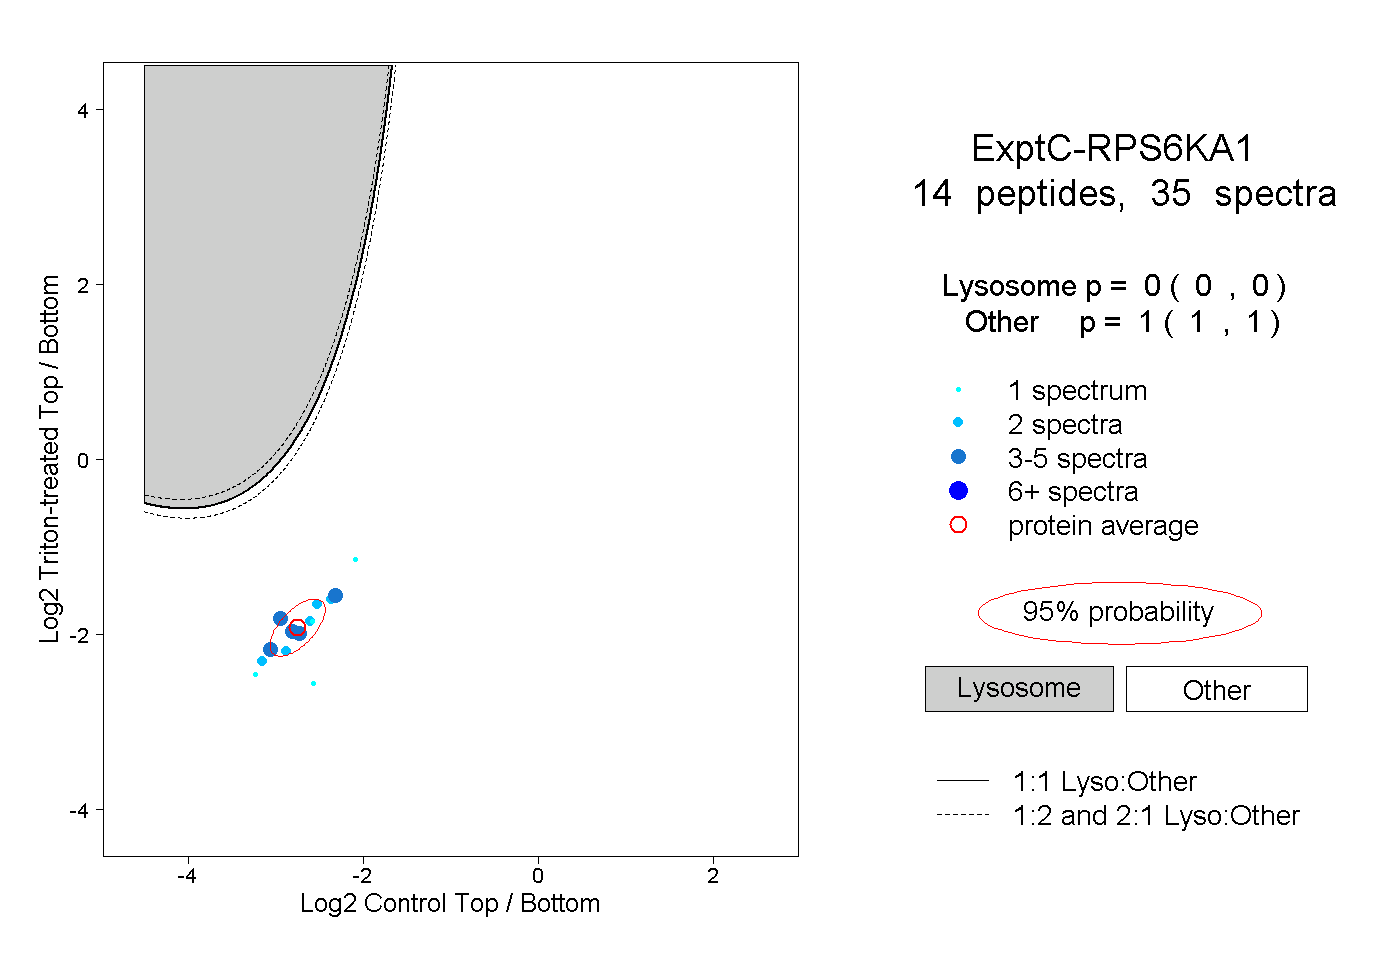
0.000 | 0.000
1.000 | 1.000
5peptides
spectra
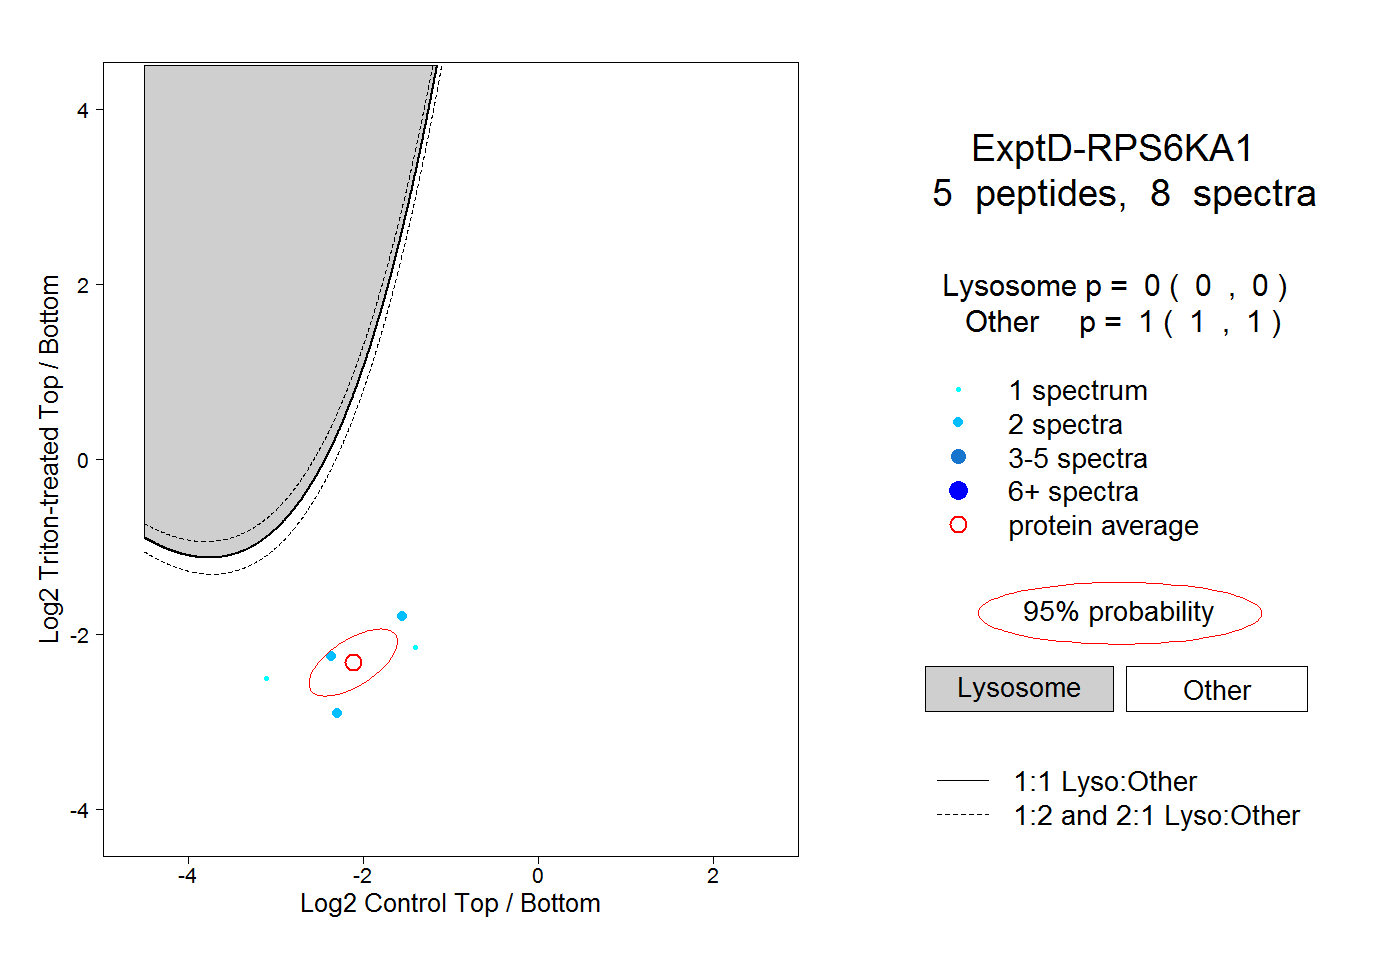
0.000 | 0.000
1.000 | 1.000