RPS6KA1
[ENSRNOP00000060054]
Main page
| | | Plot |
Mito |
Lyso |
|
Perox |
ER |
Golgi |
PM |
Cytosol |
Nucleus |
|
| Expt A |
 14
14
peptides |
37
spectra |
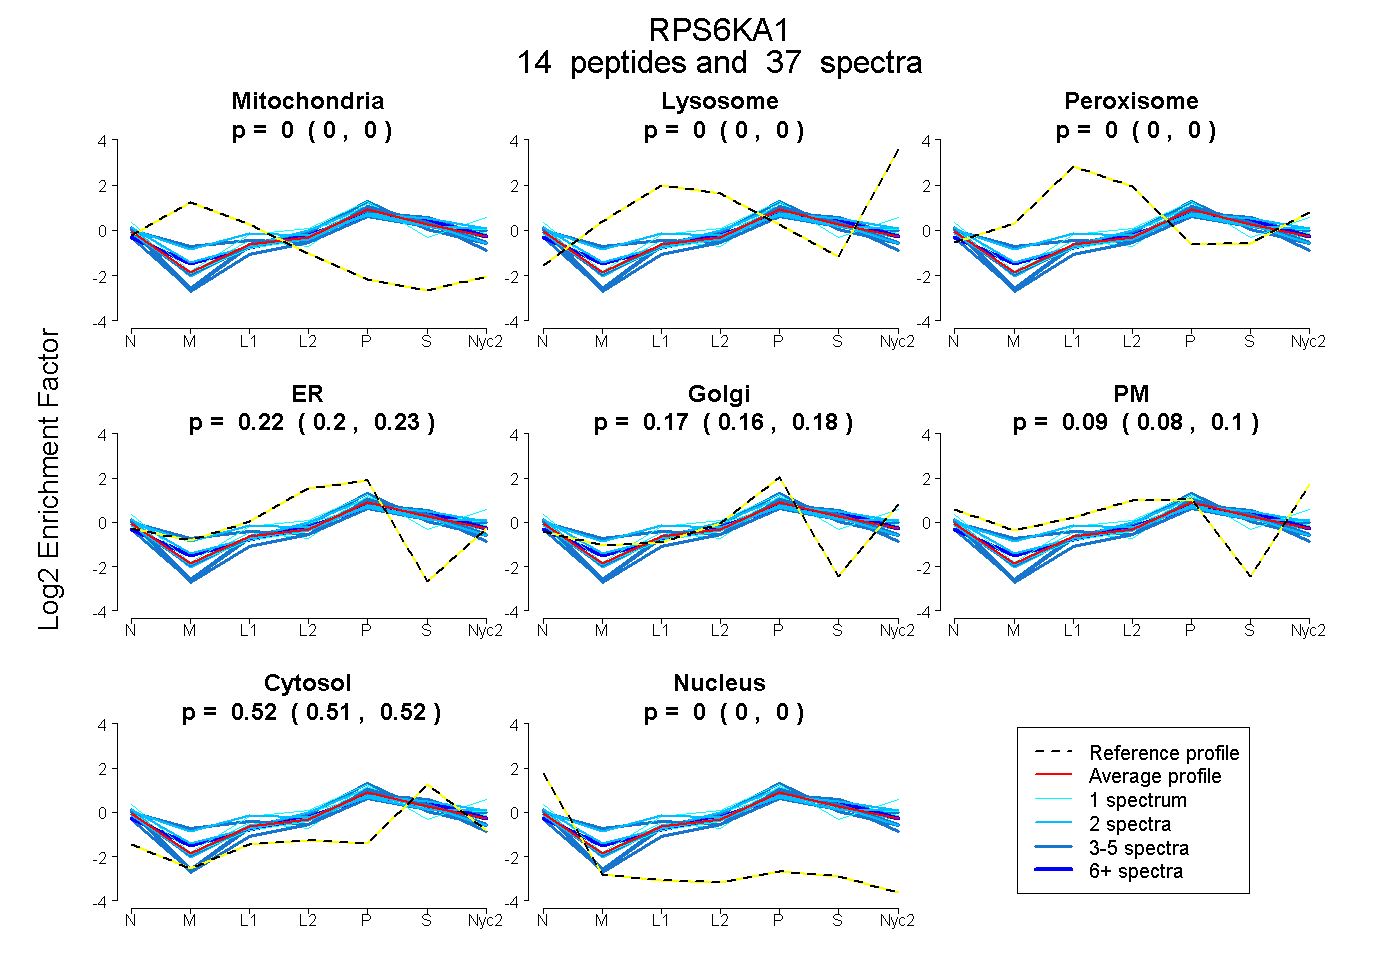 |
0.000
0.000 | 0.000 |
0.000
0.000 | 0.000 |
|
0.000
0.000 | 0.002 |
0.217
0.204 | 0.228 |
0.171
0.159 | 0.182 |
0.093
0.080 | 0.103 |
0.519
0.515 | 0.522 |
0.000
0.000 | 0.000 |
|
| | | Plot |
Mito |
|
Lyso or Perox |
|
ER |
Golgi |
PM |
Cytosol |
Nucleus |
|
| Expt B |
5
peptides |
7
spectra |
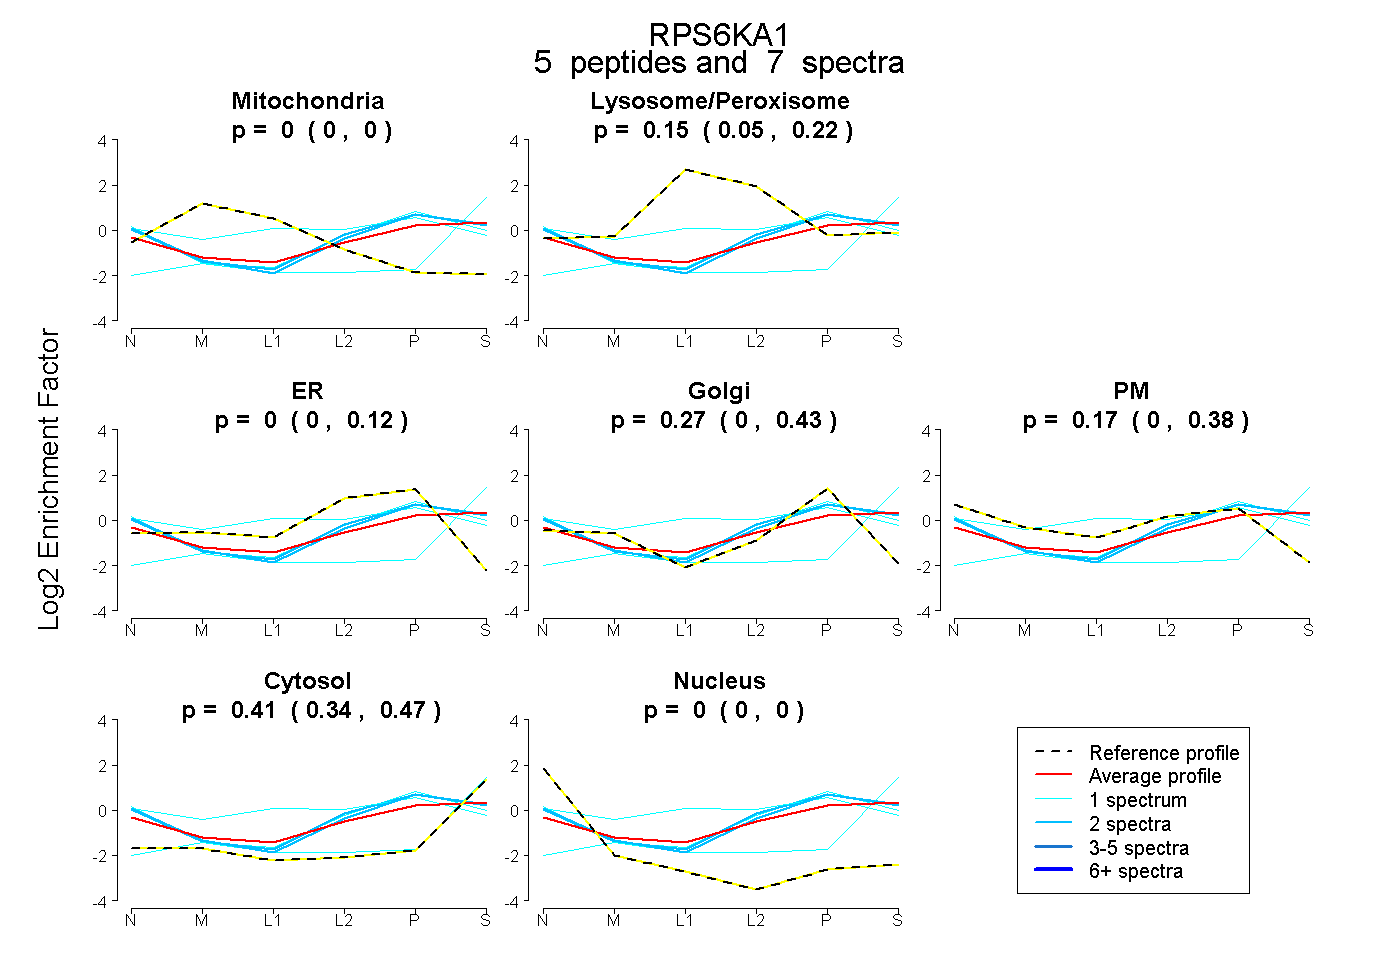 |
0.000
0.000 | 0.000 |
|
0.150
0.054 | 0.216 |
|
0.000
0.000 | 0.120 |
0.274
0.000 | 0.426 |
0.166
0.000 | 0.383 |
0.409
0.344 | 0.475 |
0.000
0.000 | 0.000 |
|
| 1 spectrum, QVLQHPWITQK |
0.000 |
|
0.380 |
|
0.000 |
0.238 |
0.241 |
0.142 |
0.000 |
|
| 2 spectra, VFLVR |
0.000 |
|
0.040 |
|
0.025 |
0.286 |
0.303 |
0.345 |
0.000 |
|
| 1 spectrum, GGDLFTR |
0.000 |
|
0.051 |
|
0.000 |
0.000 |
0.000 |
0.949 |
0.000 |
|
| 1 spectrum, ADPSHFELLK |
0.000 |
|
0.089 |
|
0.005 |
0.355 |
0.276 |
0.275 |
0.000 |
|
| 2 spectra, EASFVLYTISK |
0.000 |
|
0.057 |
|
0.115 |
0.205 |
0.272 |
0.351 |
0.000 |
|
| | | Plot |
|
Lyso |
|
|
|
|
|
|
|
Other |
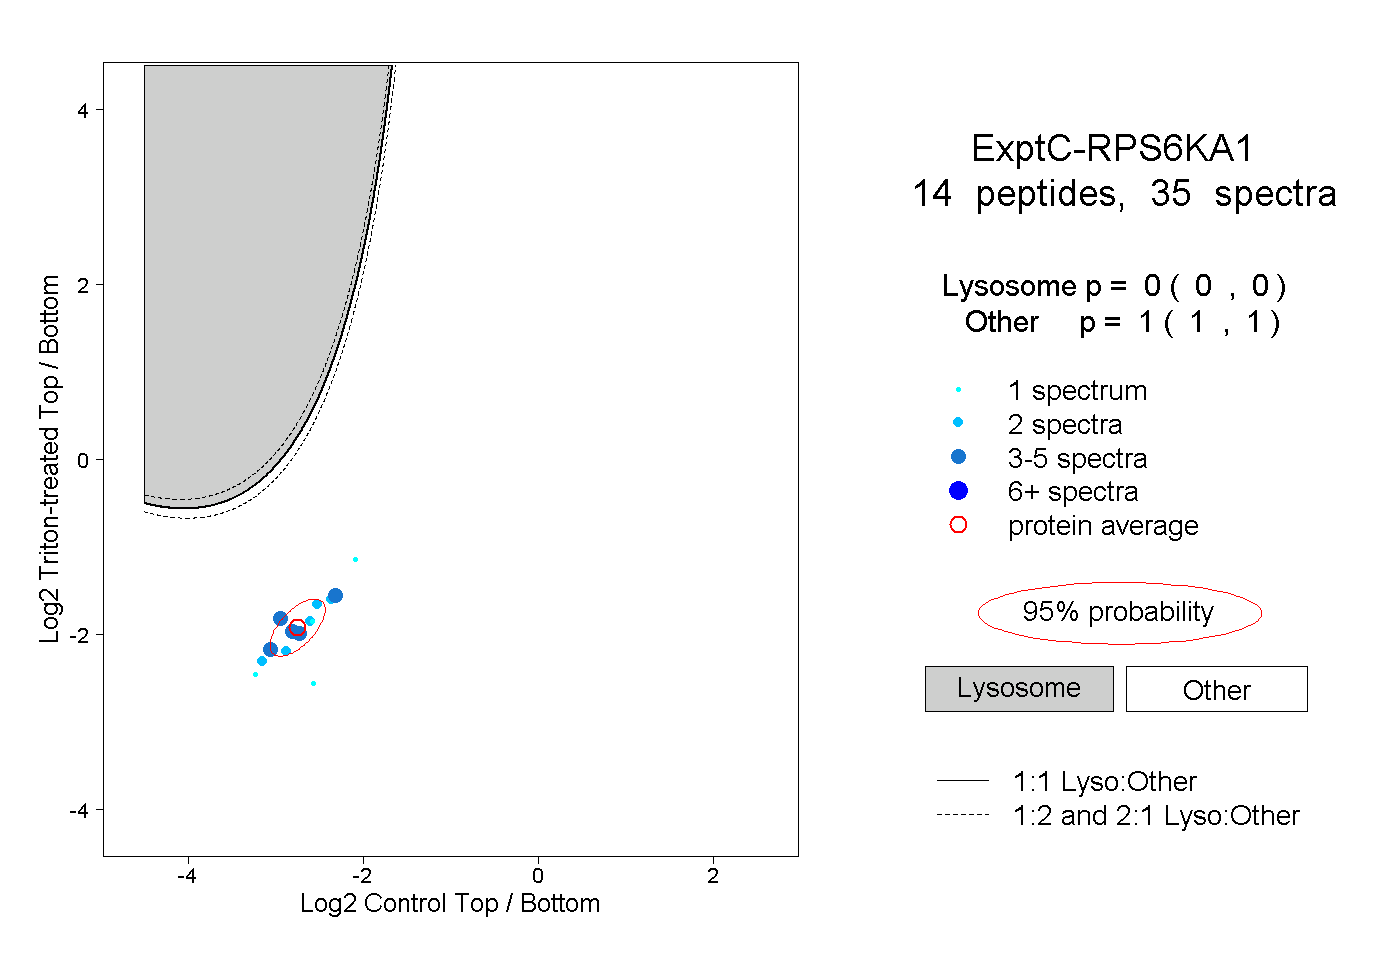
| Expt C |
14
peptides |
35
spectra |
 |
|
0.000
0.000 | 0.000 |
|
|
|
|
|
|
|
1.000
1.000 | 1.000 |
| | | Plot |
|
Lyso |
|
|
|
|
|
|
|
Other |
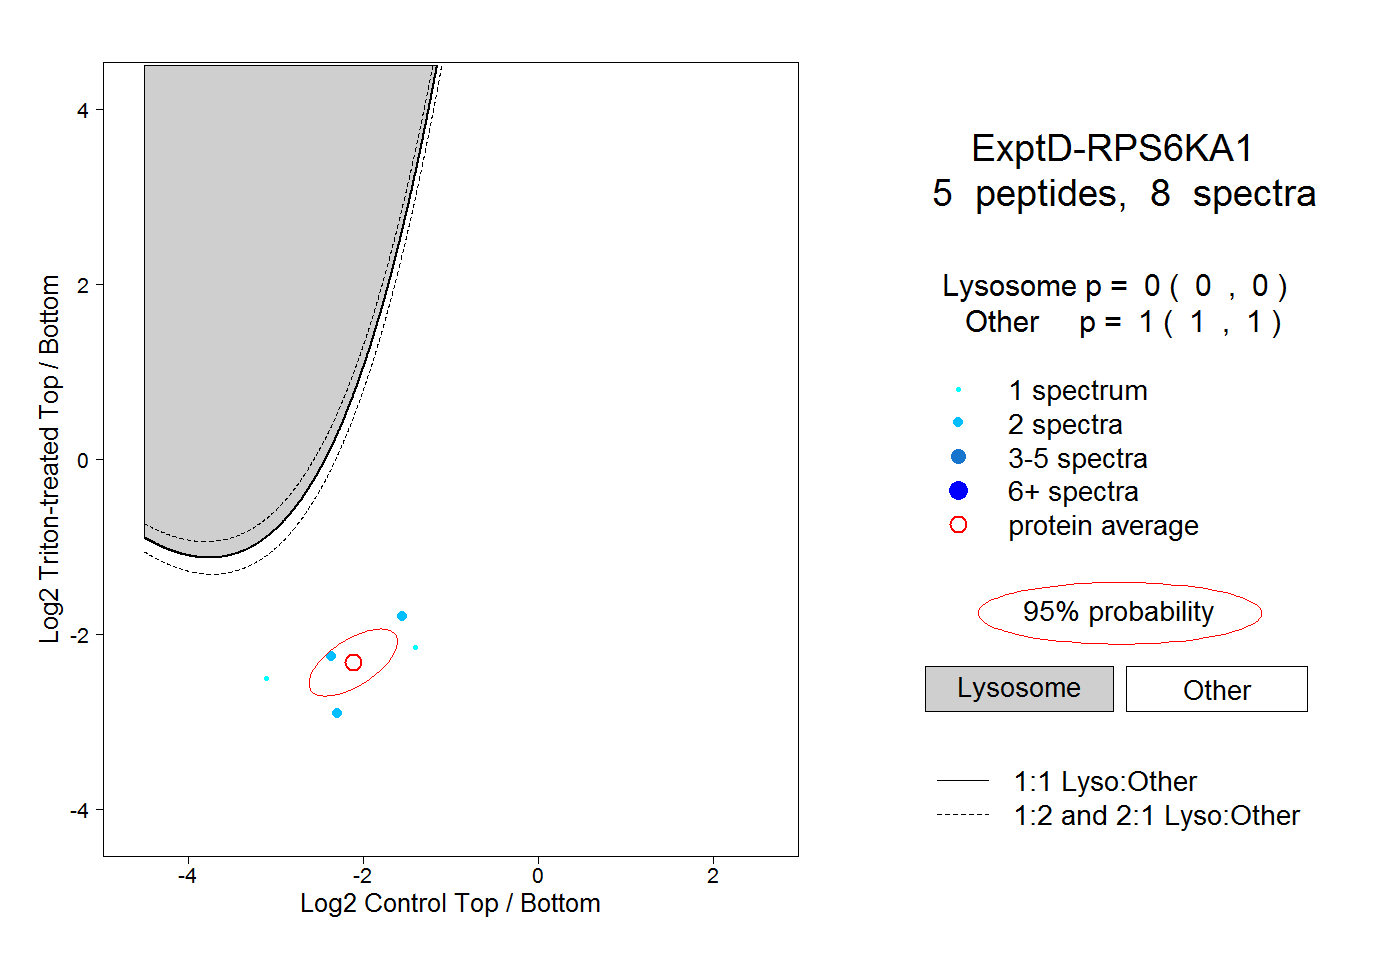
| Expt D |
5
peptides |
8
spectra |
 |
|
0.000
0.000 | 0.000 |
|
|
|
|
|
|
|
1.000
1.000 | 1.000 |